


VU.CITY-icon-Brighton-light
3D-icon-alt-white

Brighton 3D Model

Work with confidence using Brighton’s leading digital twin

Explore, plan, analyse and present your work on a survey-accurate 3D model of Brighton & Hove, including approved and under-construction buildings. Use rich data layers to assess site potential, spot constraints early and reduce project risk, all in one digital twin your whole team can work in.

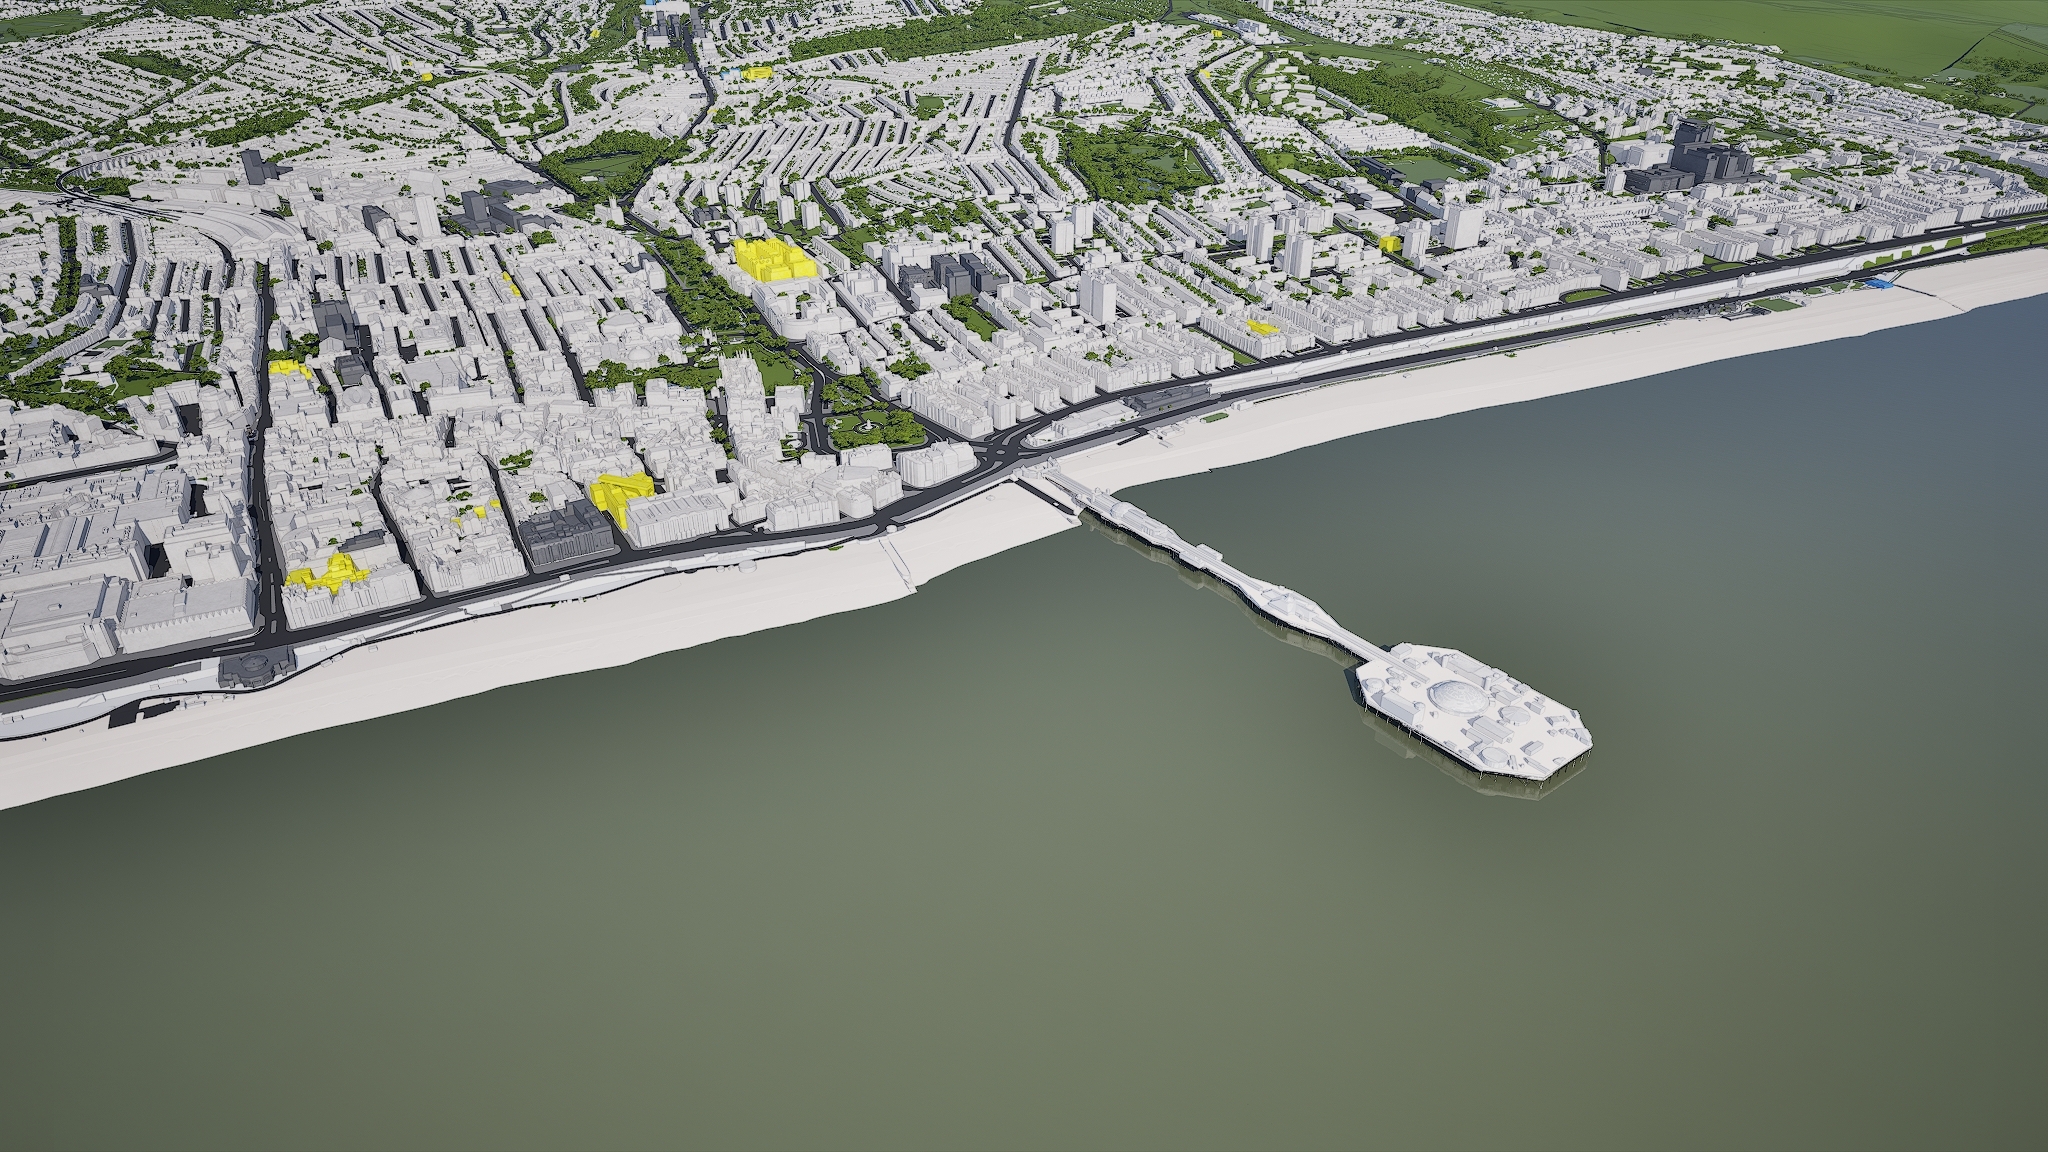
Brighton in VU.CITY 3D model
  • data-icon-white-2
    40
    DATA LAYERS
  • 38.75 sq km
    MODELLED TO 15CM ACCURACY
  • 3
    HIGH DETAIL BUILDINGS
  • 104
    Consents approved
  • 185,887
    TREES, ACCURATE HEIGHT AND CANOPY

See Brighton’s past, present & future in VU.CITY

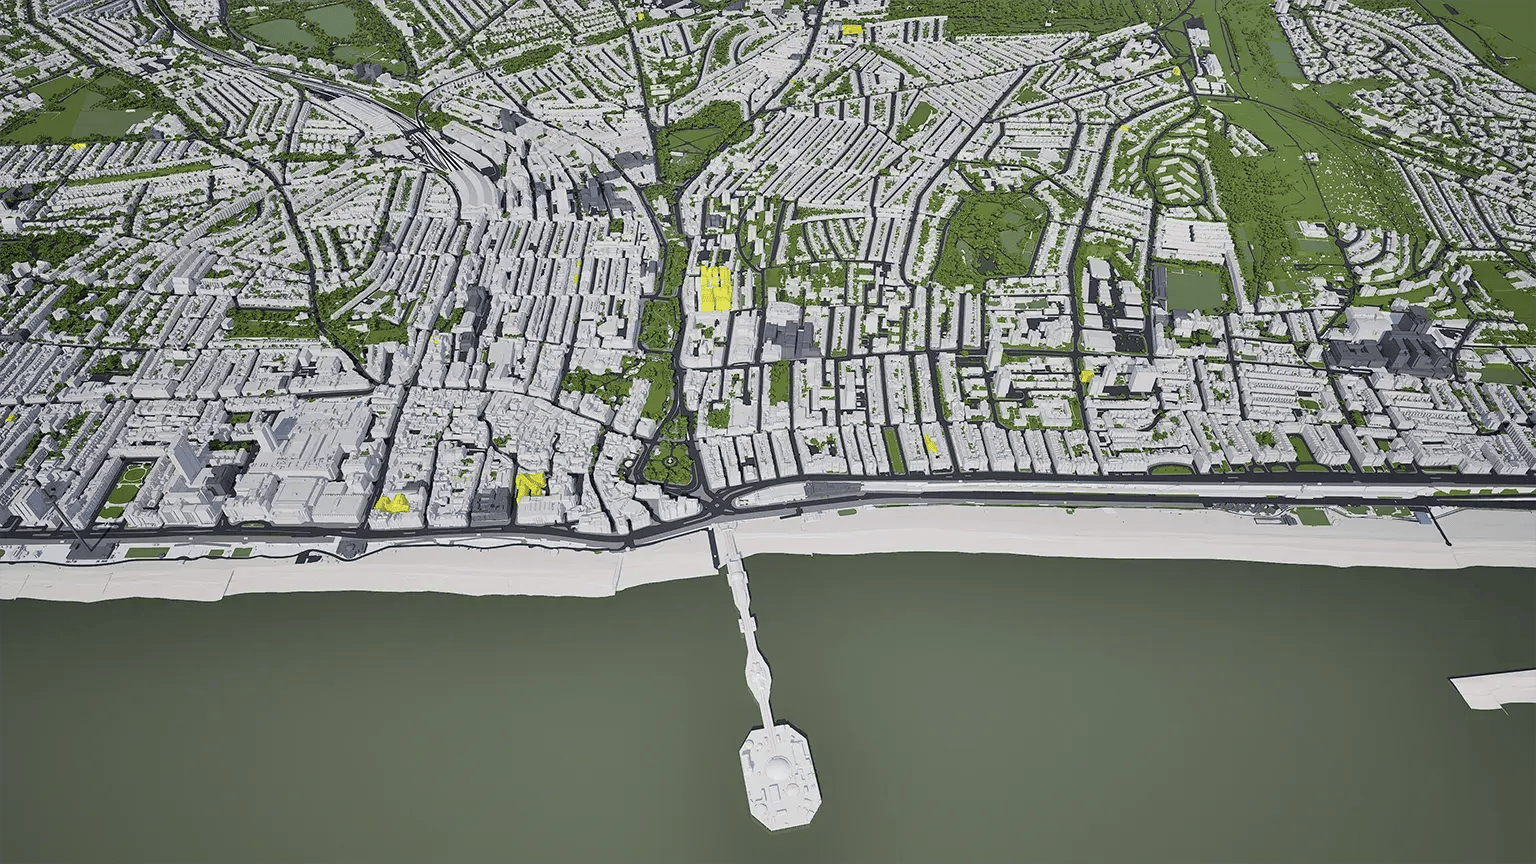
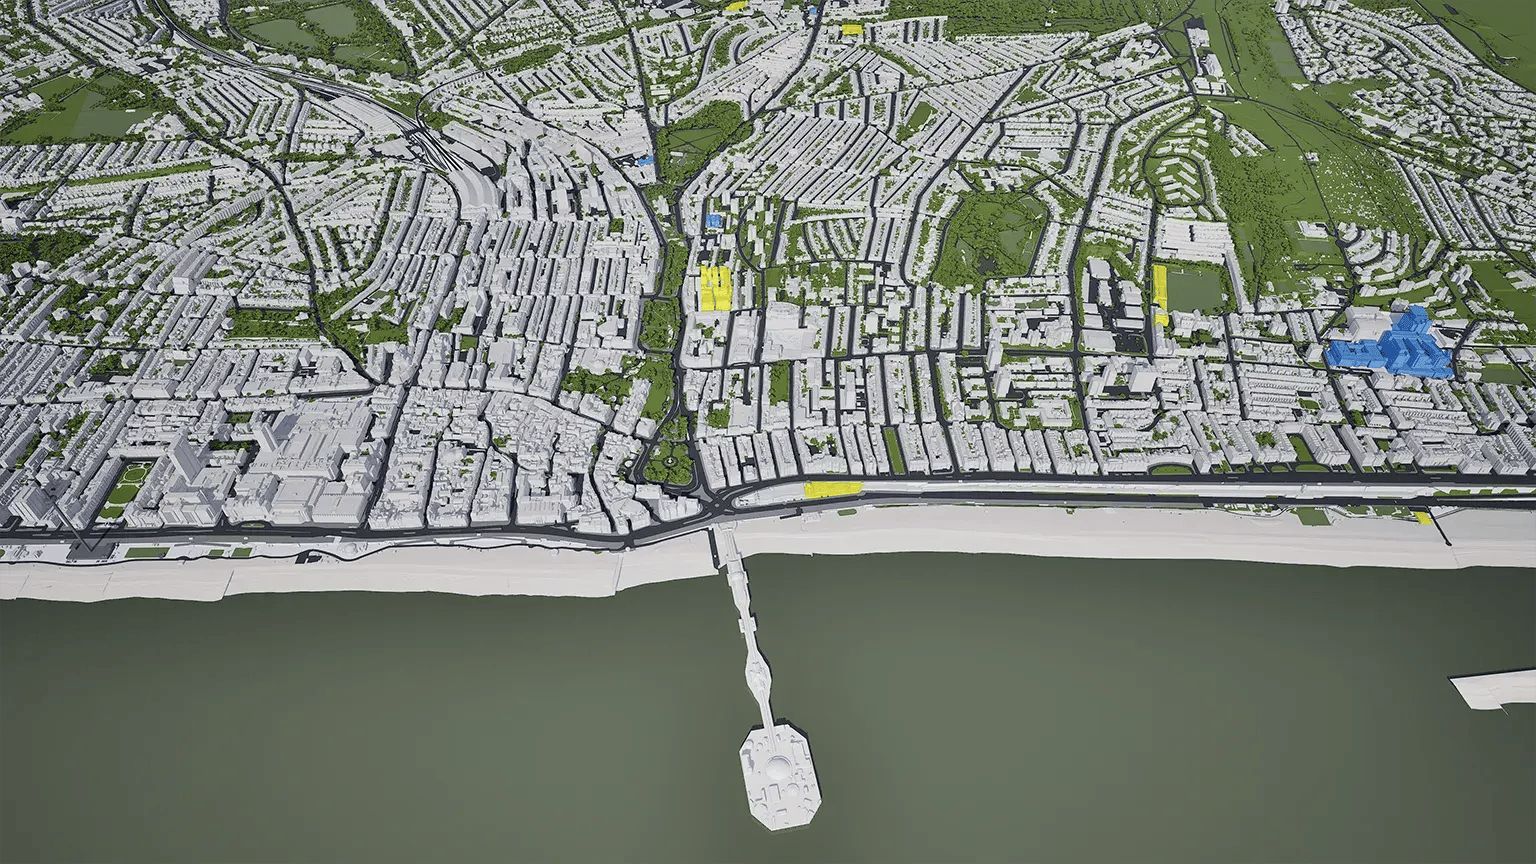
Brighton consented timeline 2026 shown in VU.CITY Brighton in 2016 Brighton in 2026
Models. Data. Tools. All in one platform.

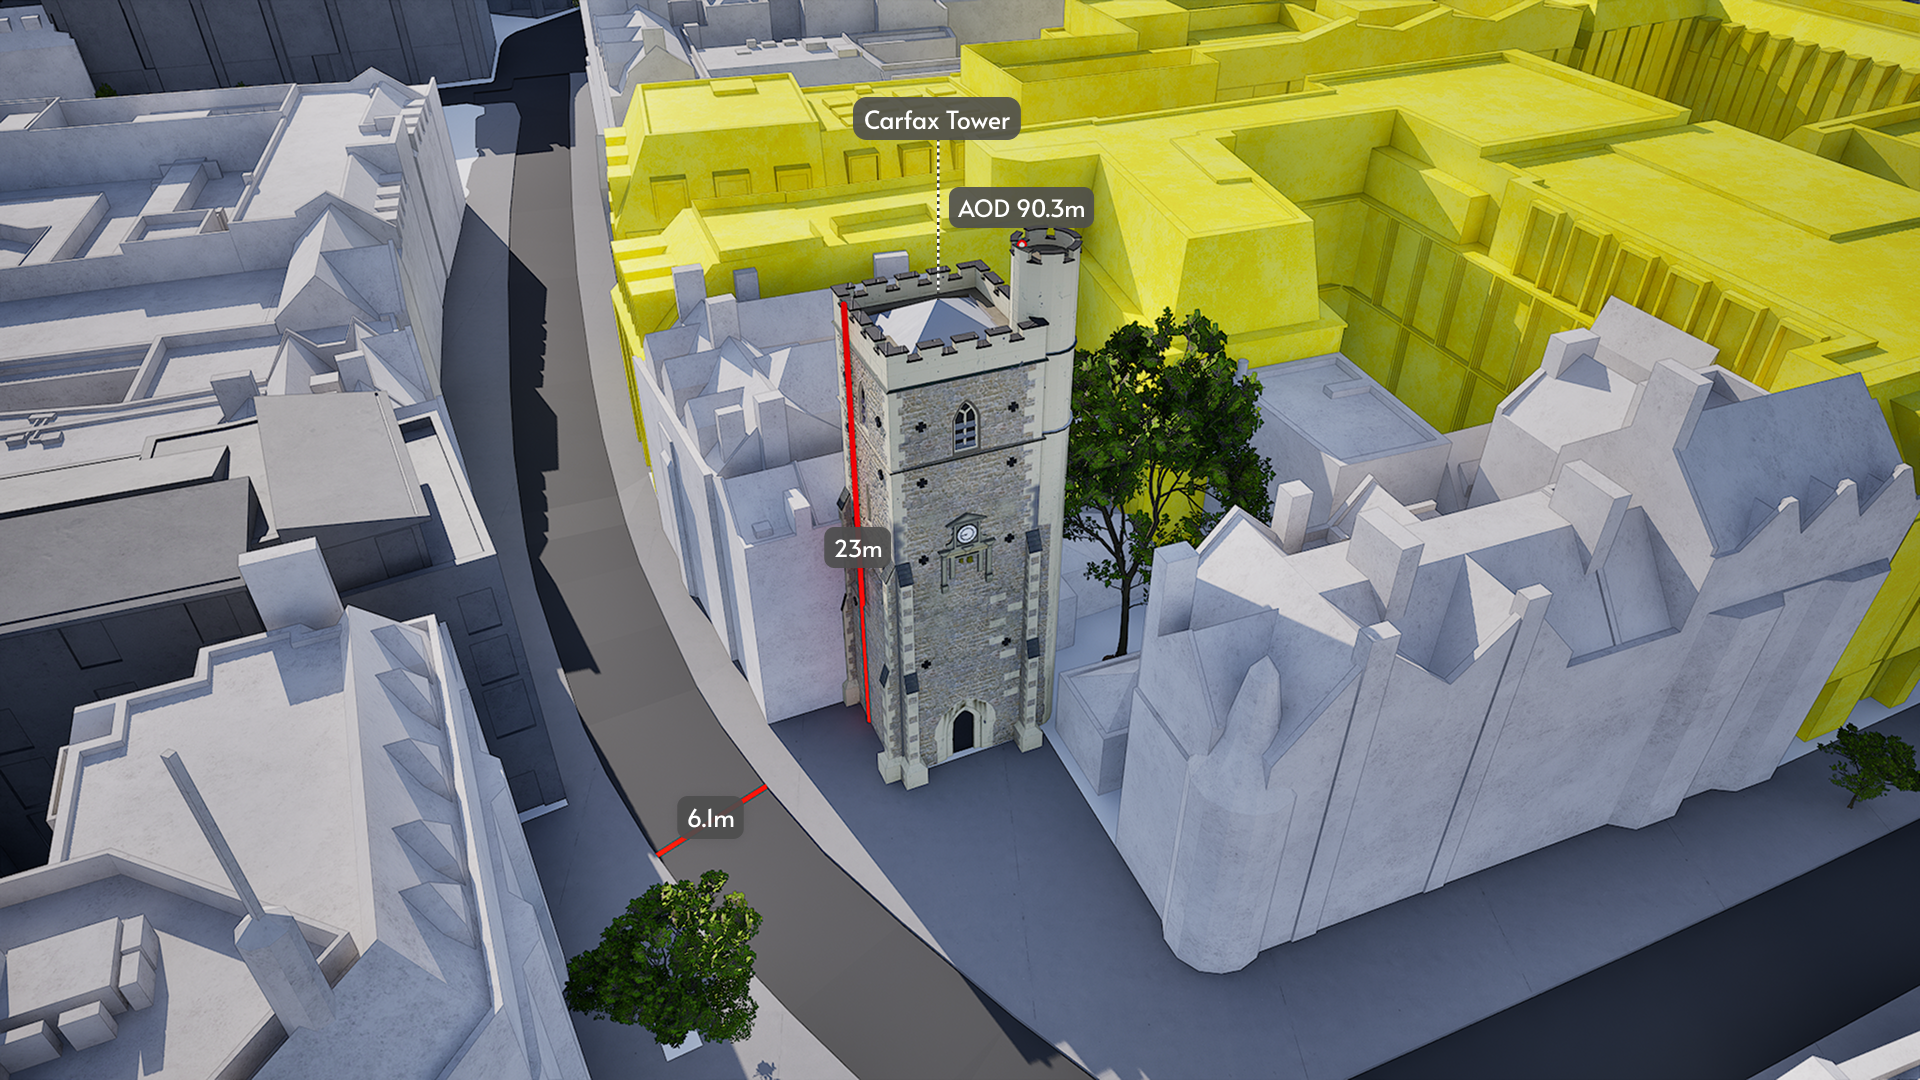
Oxford Carfax Accuracy

We provide the most accurate and detailed managed city models available. ±15cm for all buildings, trees and terrain.

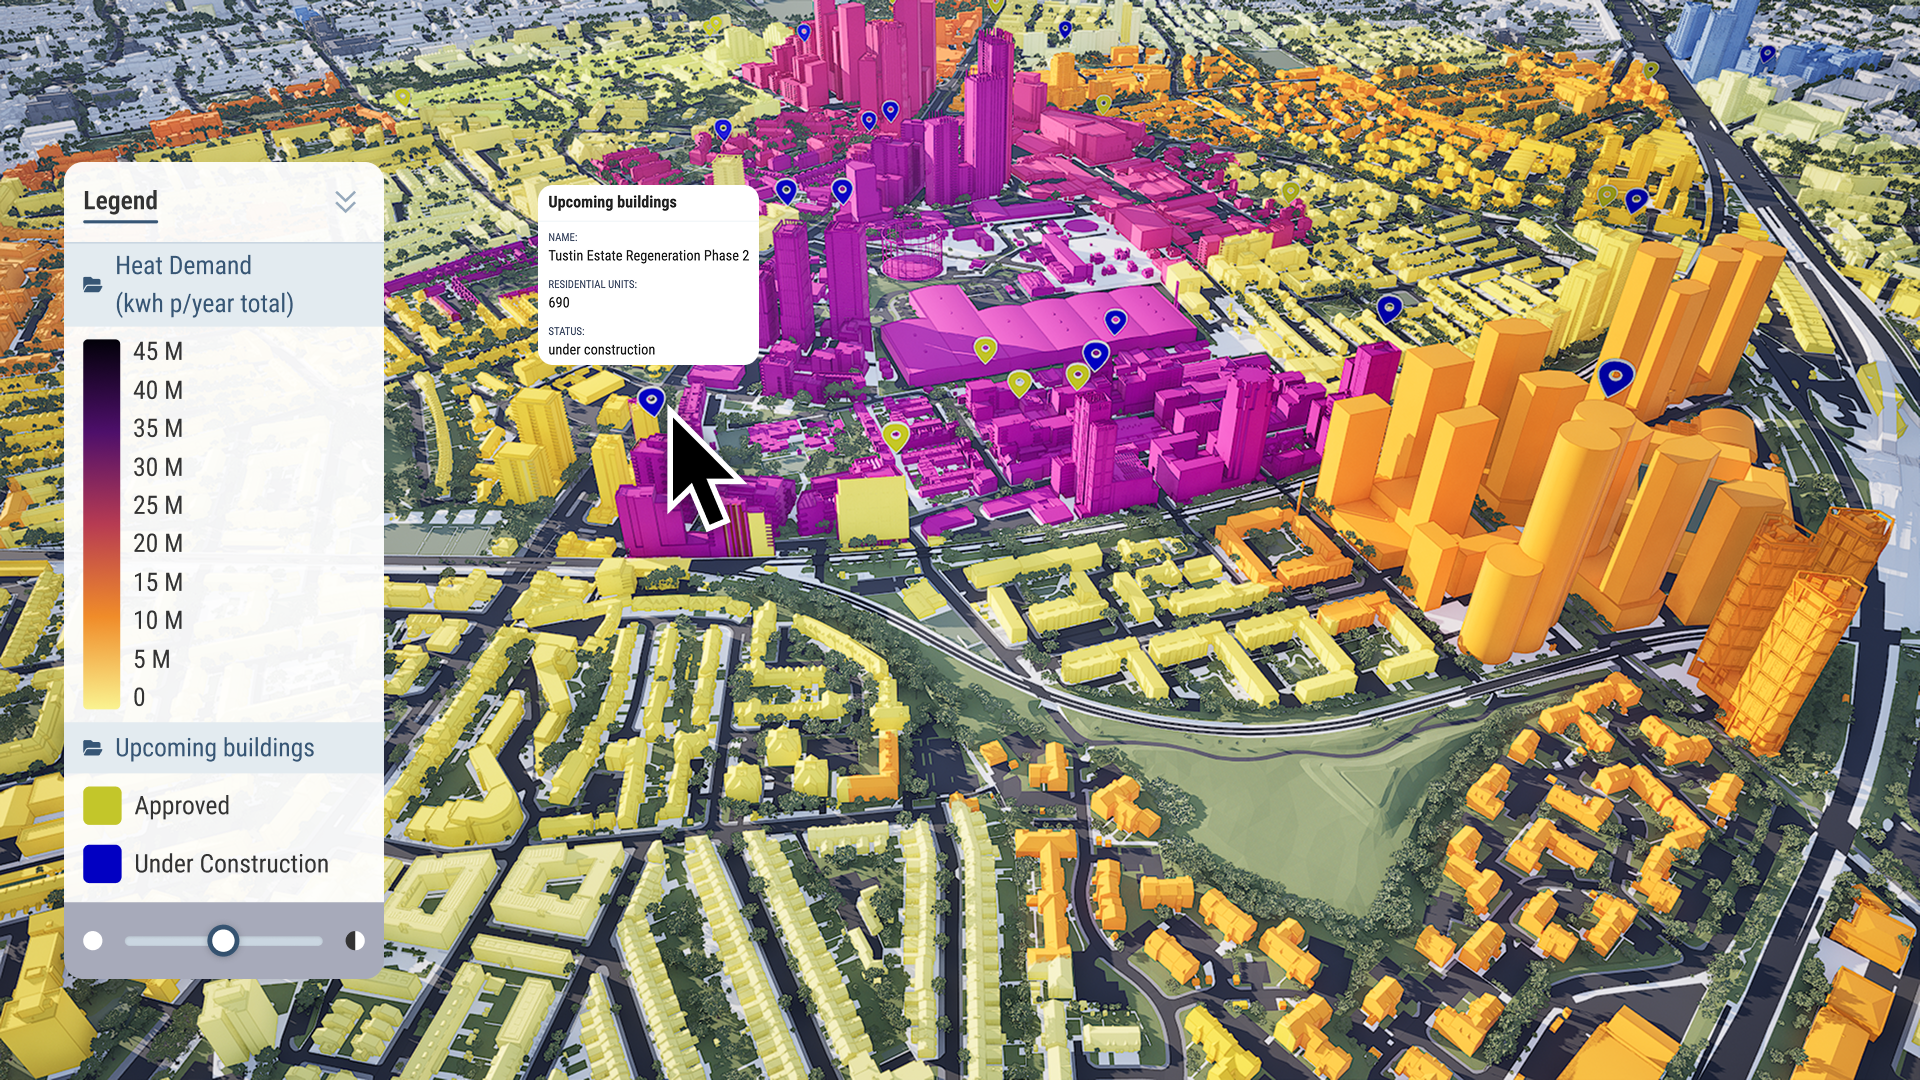
Developments + data

Our public data is available to all users. You can also import your own, private data for your projects. Visualise, analyse and filter large-scale data sets with ease.

3D draw

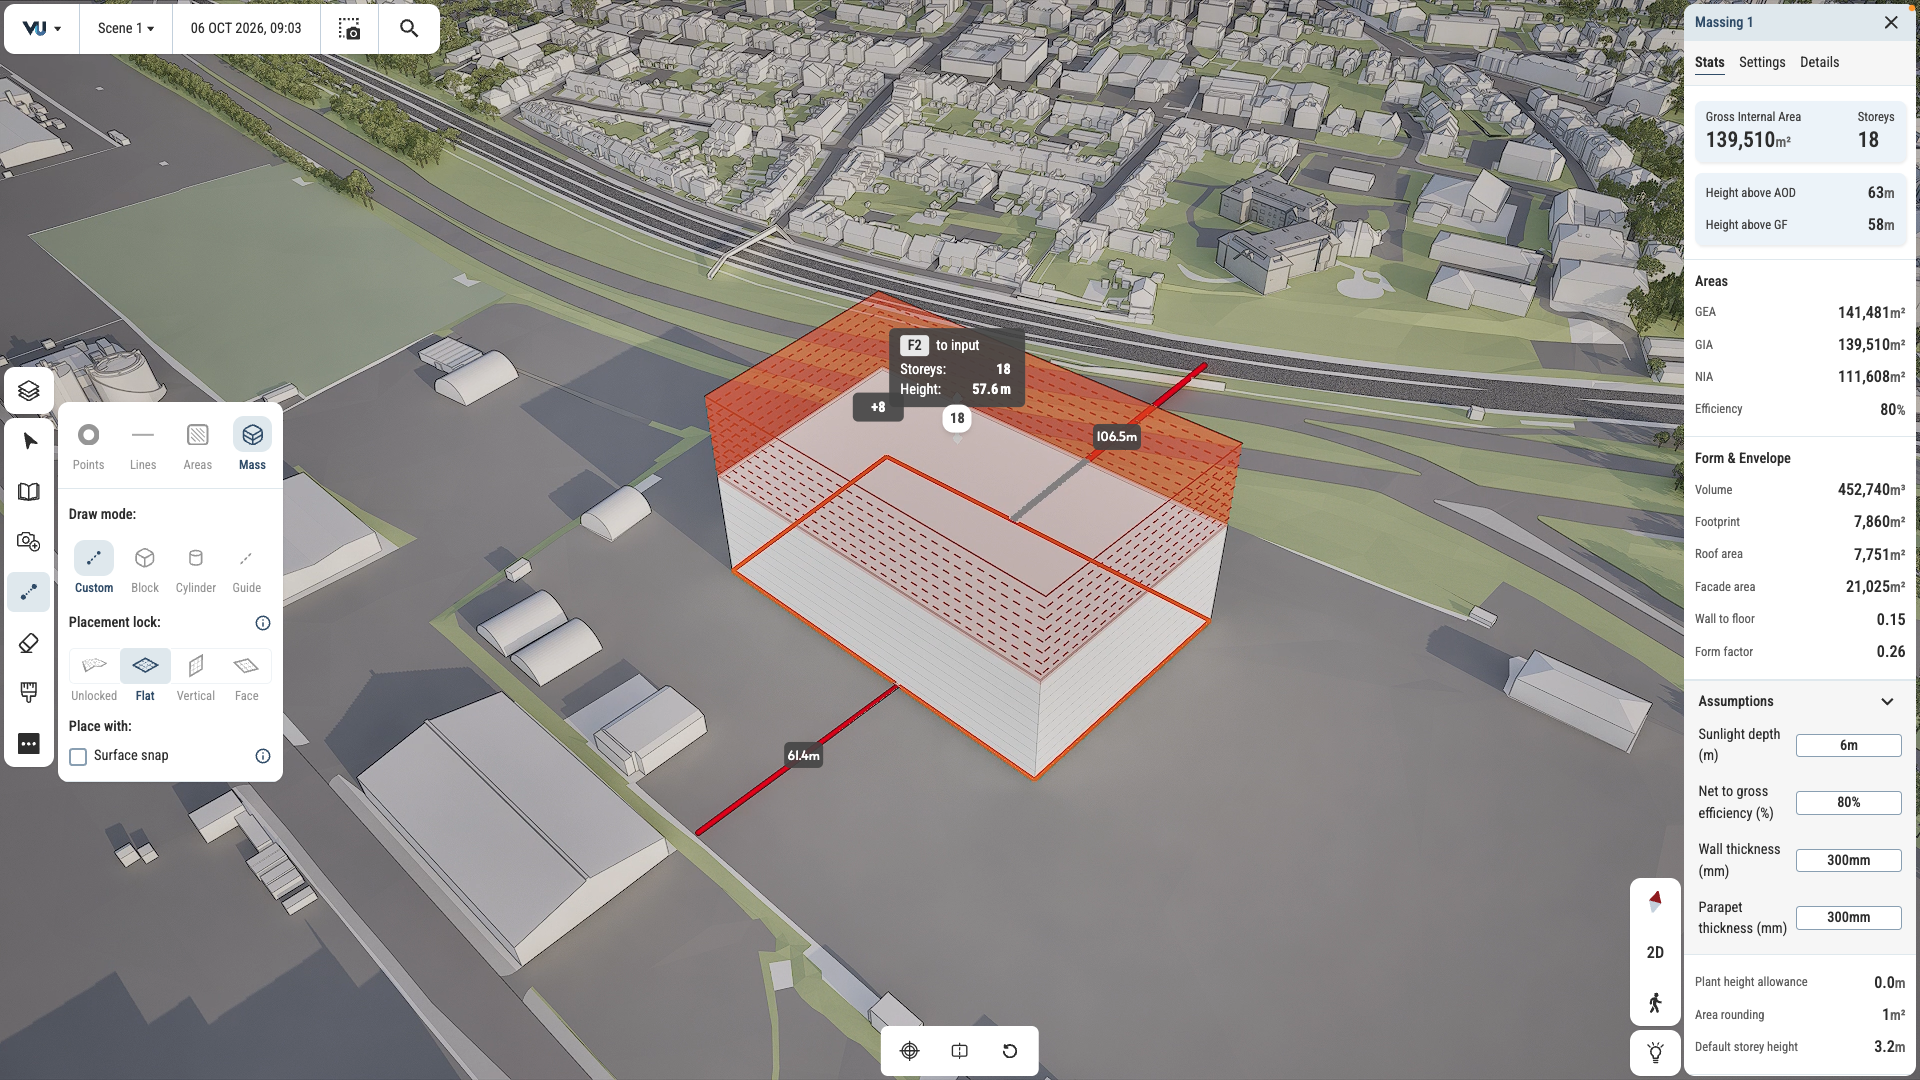
Test and iterate ideas in survey-accurate context. Draw in 2D and 3D. Mark up plans and create maps with stakeholder-ready visual quality.

VU.CITY ZTV Analysis-1

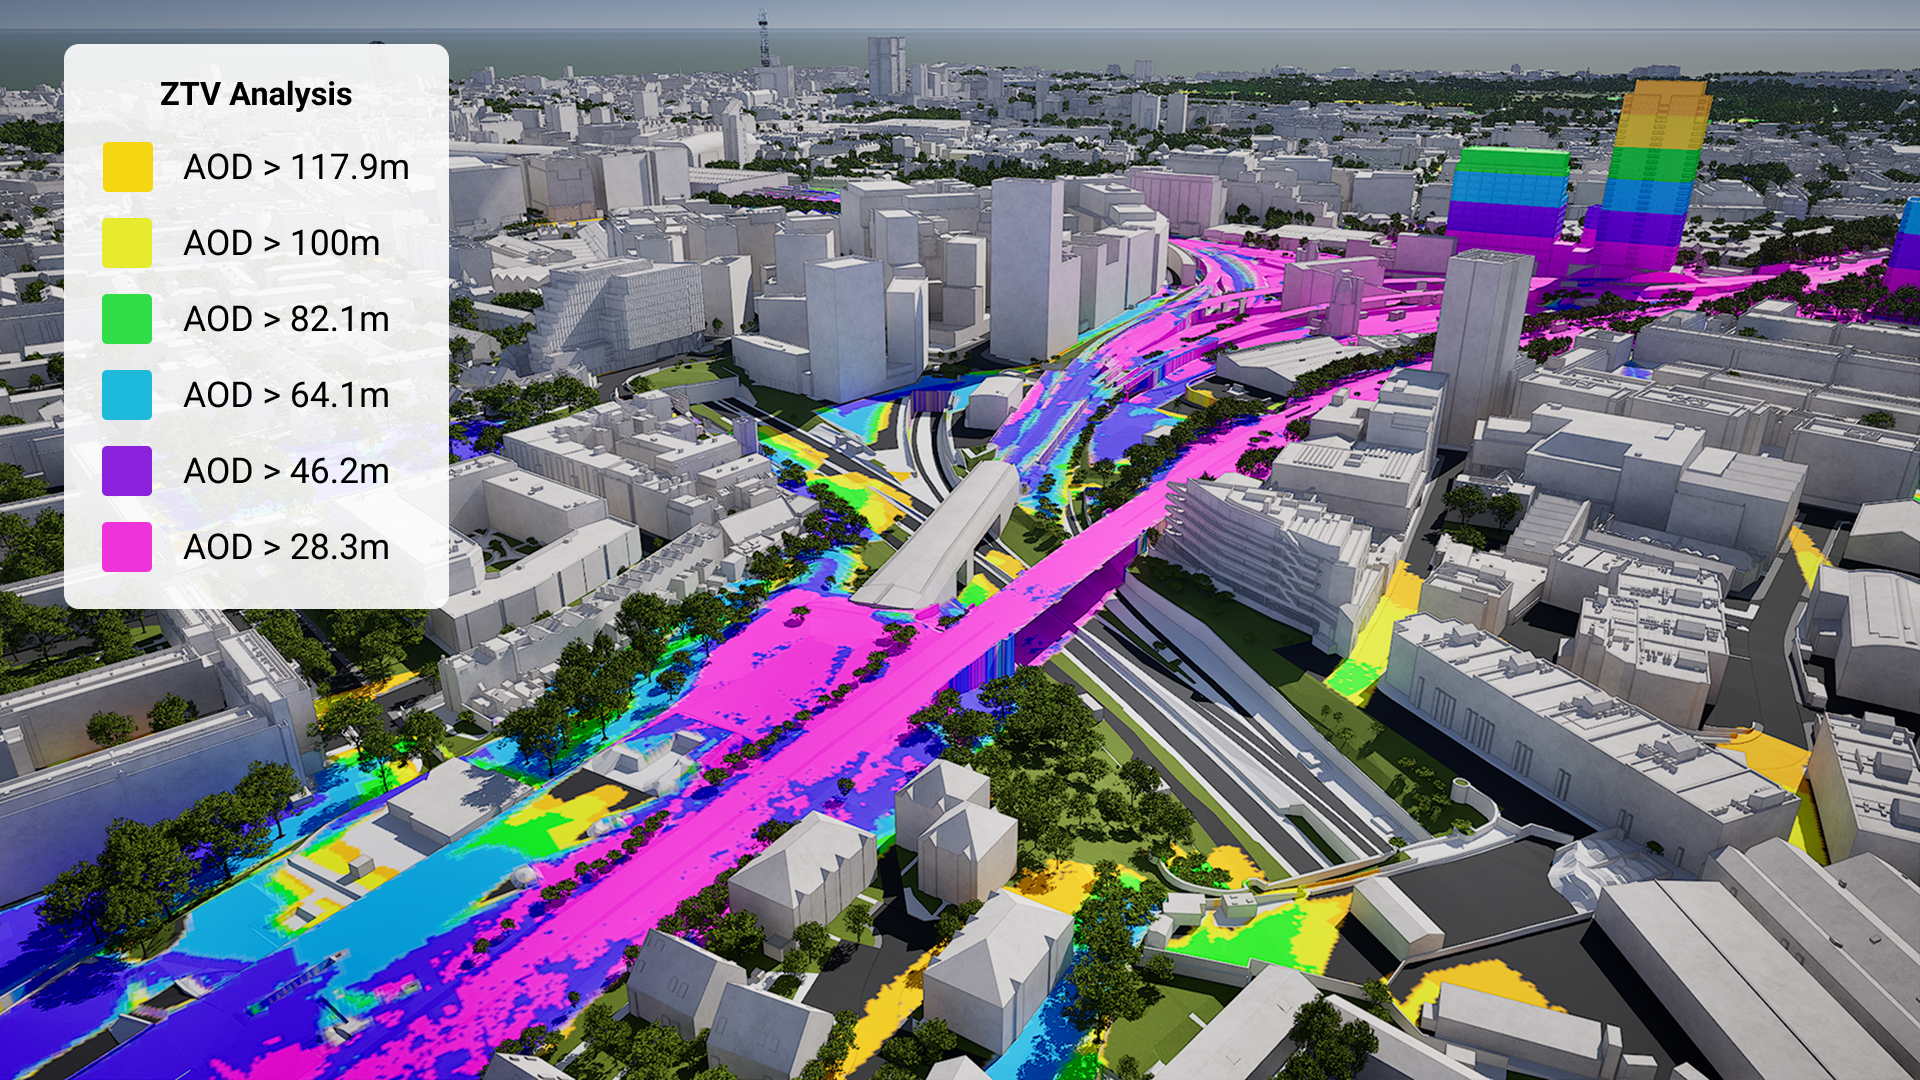
Generate ZTV studies and viewsheds in just a few clicks. See sunlight paths and overshadowing instantly.

Visualise Real Estate assets and their views out in 4D

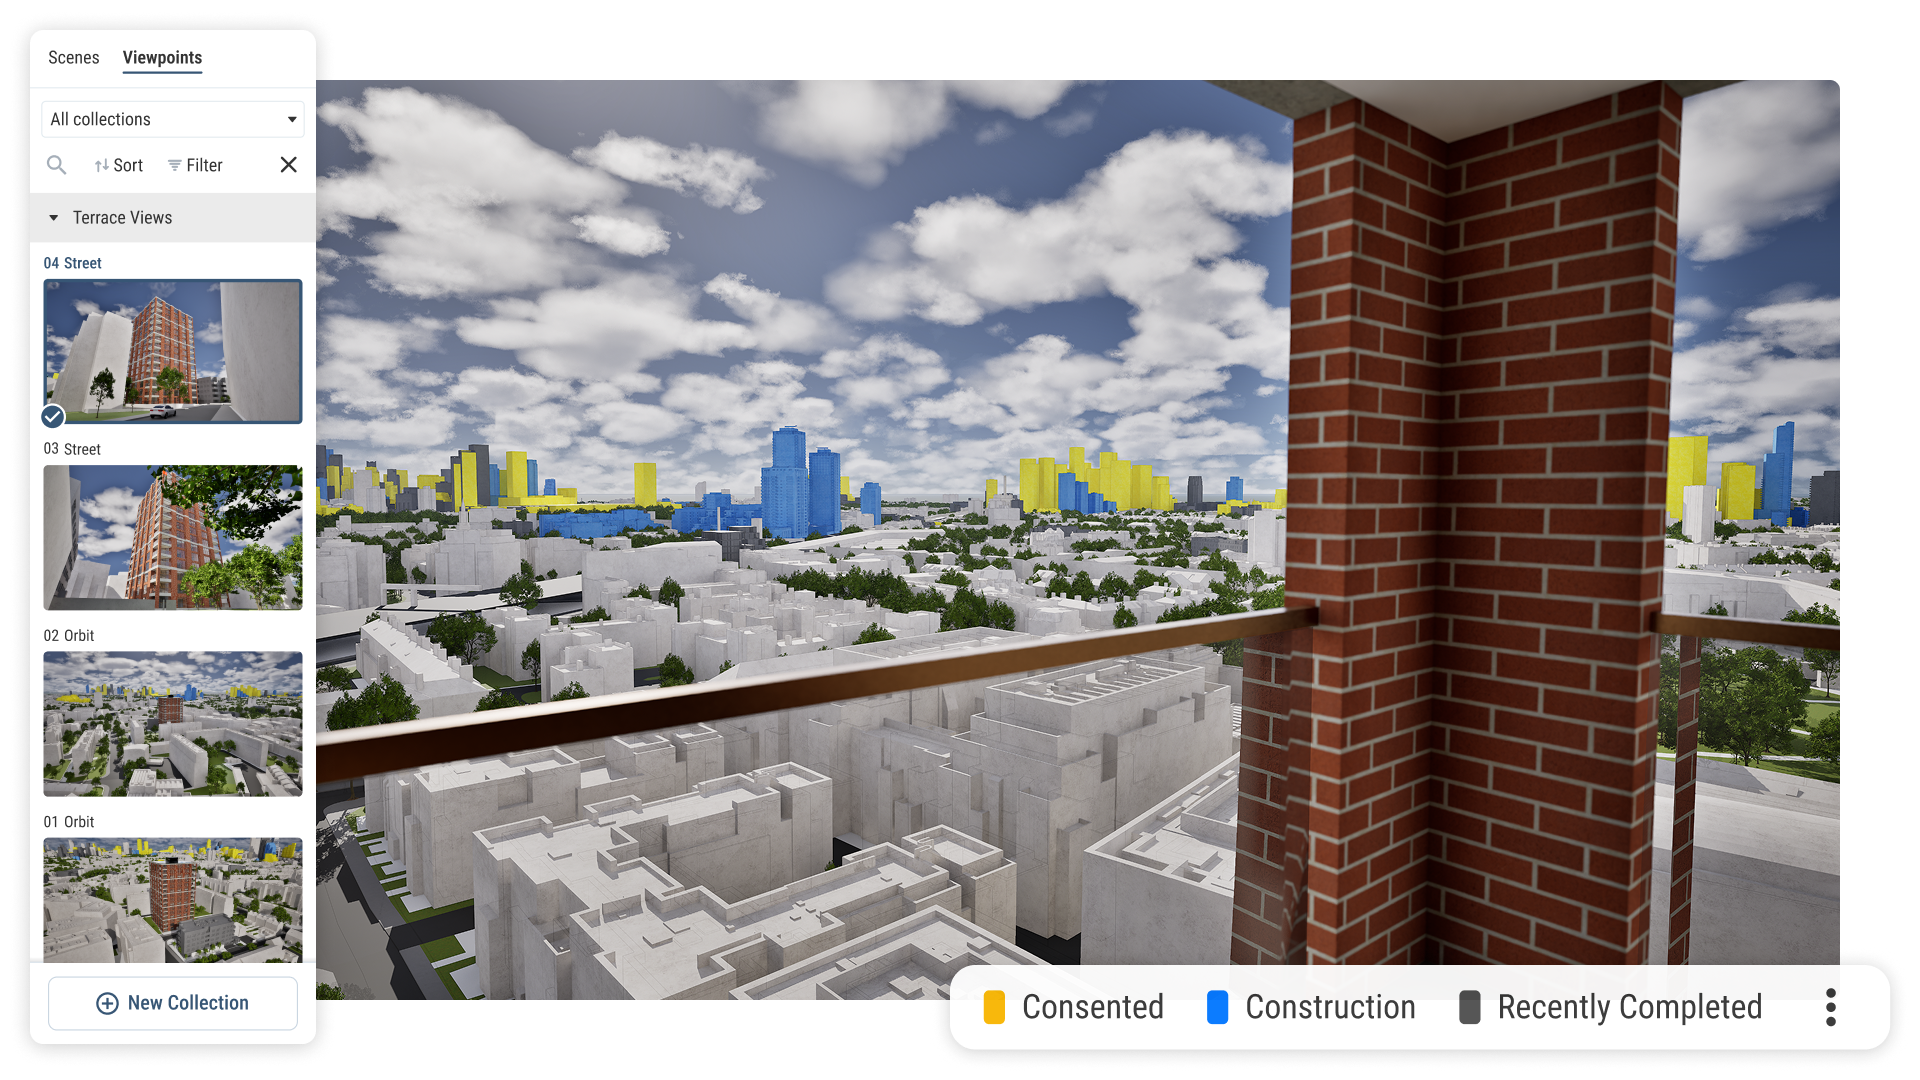
Create guided tours and presentations, export high quality imagery and share files with stakeholders for seamless collaboration and feedback.

GeometrySurvey-grade 3D city models
DataA public data library
Design toolsDraw, measure, annotate
Analysis toolsVisibility, sunlight and more
Presentation toolsTell your story, your way

Survey accurate Brighton coverage

From the seafront to the edge of the South Downs, our Brighton 3D model is mapped to 15cm accuracy.

data-icon-white-2

Brighton data layers for contextual viability

From transportation and zoning to environmental factors, VU.CITY Brighton 3D model data layers provide essential insights for more informed and confident decision-making.

Administrative Boundaries

  • Certificate of Immunity polygons

  • Local authority districts

Amenities & Services

  • Educational Establishments

  • GPs

  • Locally Important Buildings

  • Retail Boundaries

  • Supermarkets

Demographics & Economy

  • Annual Average Income Per Household

  • Deprivation Index

  • House Prices

Environmental

  • Air Quality Management Areas

  • Ancient Woodland

  • Local Nature Reserves

  • Rail noise

  • Sites of Special Scientific Interest

  • Special Areas Of Conservation

Green Spaces & Open Areas

  • Open green spaces

  • Parks and gardens

Heritage & Conservation

  • Certificate of Immunity points

  • Conservation Areas

  • Designated sites

  • Heritage at risk

  • Listed Building points

  • Listed Buildings polygons

  • Scheduled Monuments

Planning & Development

  • Article 4 Direction 

  • Developments

Transport & Accessibility

  • National Cycle Network

Hover over each card to see more

Explore VU.CITY's tools

VU.CITY-icon-Brighton-light

VU.CITY Brighton is the largest and most accurate interactive 3D model available of the coastal city

Brighton presents challenges for architects and developers due to its positioning: this tightly constrained, compact city is situated like a basin in between the South Downs National Park and the sea. There is limited scope for outward expansion and any development must be sensitive to Brighton’s many expressive landmark buildings, such as the Royal Pavilion and St Bartholomew's Church, together with its strategic views and vistas - particularly if approaching the city from the higher level of the South Downs.

VU.CITY Brighton helps stakeholders consider such wider, complex planning policies clearly and quickly for effective decision-making and outcomes.

The city’s existing housing includes a high proportion of flats, maisonettes and apartments which comprise 50% of the total housing stock.

Brighton’s challenging environmental constraint requires sensitive design, particularly in the council’s identified tall building nodes and corridors. Using VU.CITY Brighton, the impact of proposals can be easily considered in context from various angles, taking strategically important views and vistas into account to protect the city’s character.

Users of VU.CITY Brighton include EPR Architects, Brighton & Hove City Council, Brooks Murray Associates, Leonard Design Architects and Hawkins\Brown, all of whom are using the model’s many benefits. From being able to understand and assess a site’s opportunities and challenges, testing designs in context, enhancing pre-app conversations and planning submissions, to improving how everyone involved collaborates.

Brighton’s next chapter

Change is underway across Brighton & Hove. On the seafront, the Grade II* listed Madeira Terrace is being restored, and Brighton Marina continues to grow. Further major schemes include Preston Barracks, Brighton Gasworks and the Hove Station area.

With VU.CITY Brighton, you can see approved and under-construction schemes in context and test how your own plans will sit alongside them.


VU.CITY Brighton FAQs

Here are some frequently asked questions about VU.CITY's Brighton 3D Digital Twin and Model 

How can the VU.CITY Brighton model assist with planning in a constrained coastal city?

The Brighton model helps users assess developments in a compact area bounded by the South Downs and the sea. Tools like view impact analysis and massing studies support informed planning that respects Brighton’s unique landscape and character.

Can the Brighton 3D model help with testing different design options in sensitive areas?

Yes, the model enables users to test multiple massing options, especially in areas with tall building guidelines. This ensures that new developments fit within Brighton’s designated nodes and corridors without compromising strategic views.

How does the VU.CITY Brighton model enhance stakeholder and community engagement?

Features like the Camera Tool and its views enable users to create compelling visual presentations. This helps clearly communicate design impacts to stakeholders and community members, building support and facilitating feedback.

What environmental and heritage data layers are available in the Brighton model?

The model includes layers for conservation areas, listed buildings, sunlight analysis, and greenbelt boundaries, supporting environmentally responsible planning that aligns with Brighton’s local regulations and preservation efforts.

Who benefits from using the VU.CITY Brighton model?

Architects, planners, developers, and local authorities benefit from the model. It facilitates collaboration, supports responsible development, and ensures that new projects align with Brighton’s goals for sustainable growth and heritage protection.

Explore digital 3D geospatial solutions for the built environment

VU.CITY provides clear, powerful tools for key decision-makers across the built environment, helping them visualise and shape the future of cities with confidence and precision.

Make smarter decisions with data-driven insights, from infrastructure to sustainability.

Unlock the power of Generative AI for optimal design and streamlined decision-making.

Bring your designs to 3D life with state-of-the-art modelling tools.

Licence any VU.CITY city and design, test and present your project in its real context.

Utilise advanced 3D models and a data-driven approach with our flexible ZTV service.

Showcase your proposal in its real-world context with compelling, easy-to-understand flythroughs.
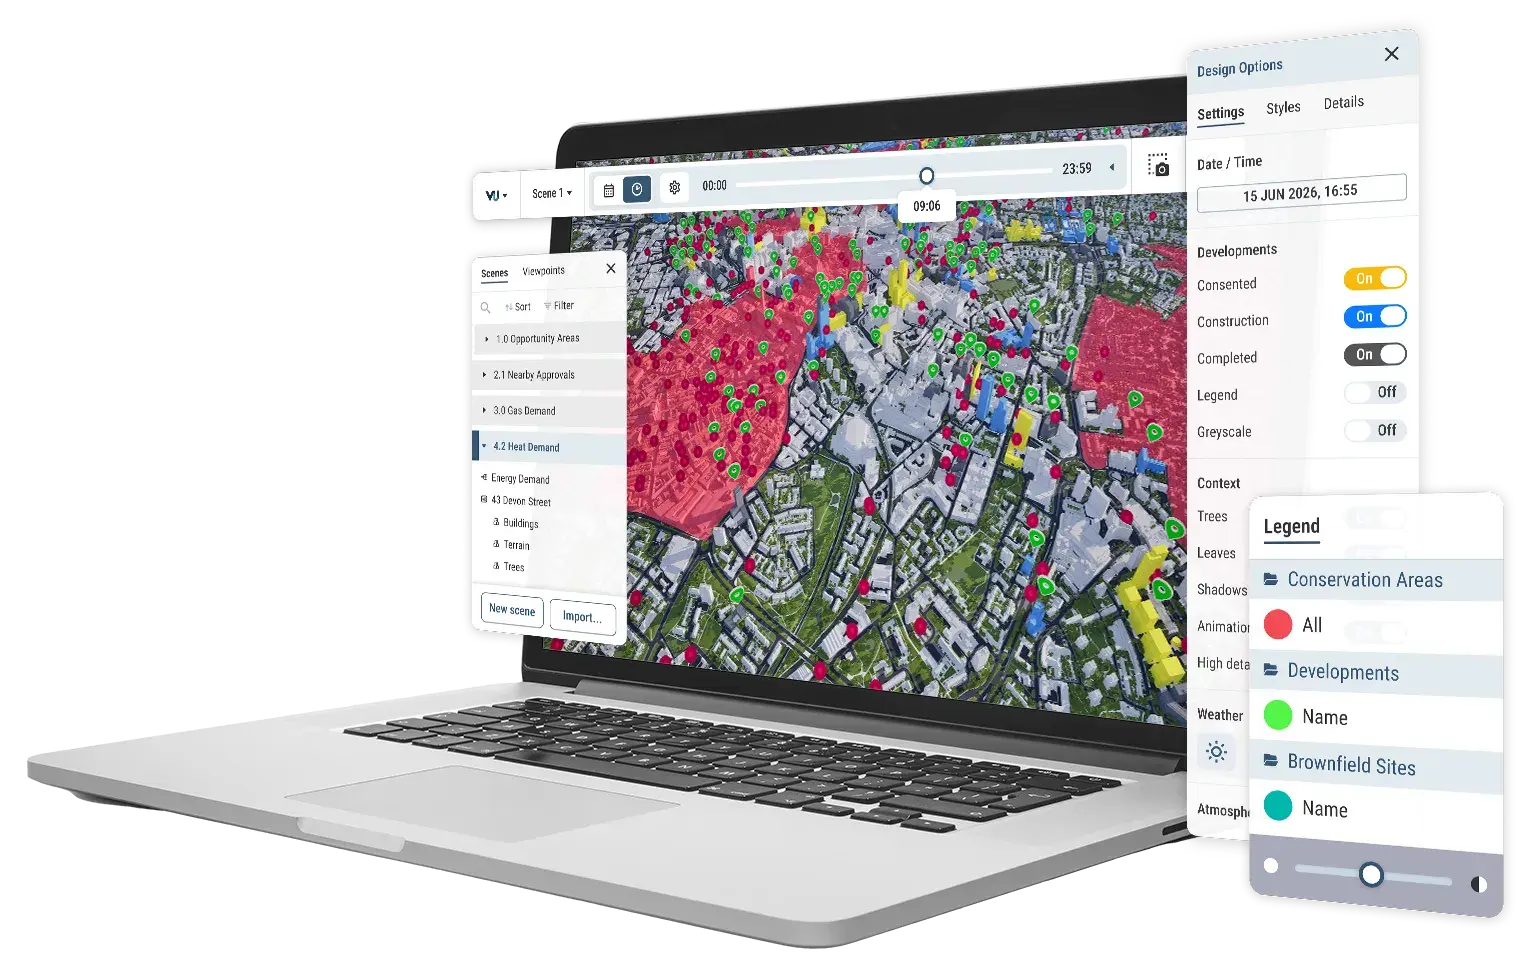
VU.CITY on a laptop showing scene manager, consented timeline, point and area data