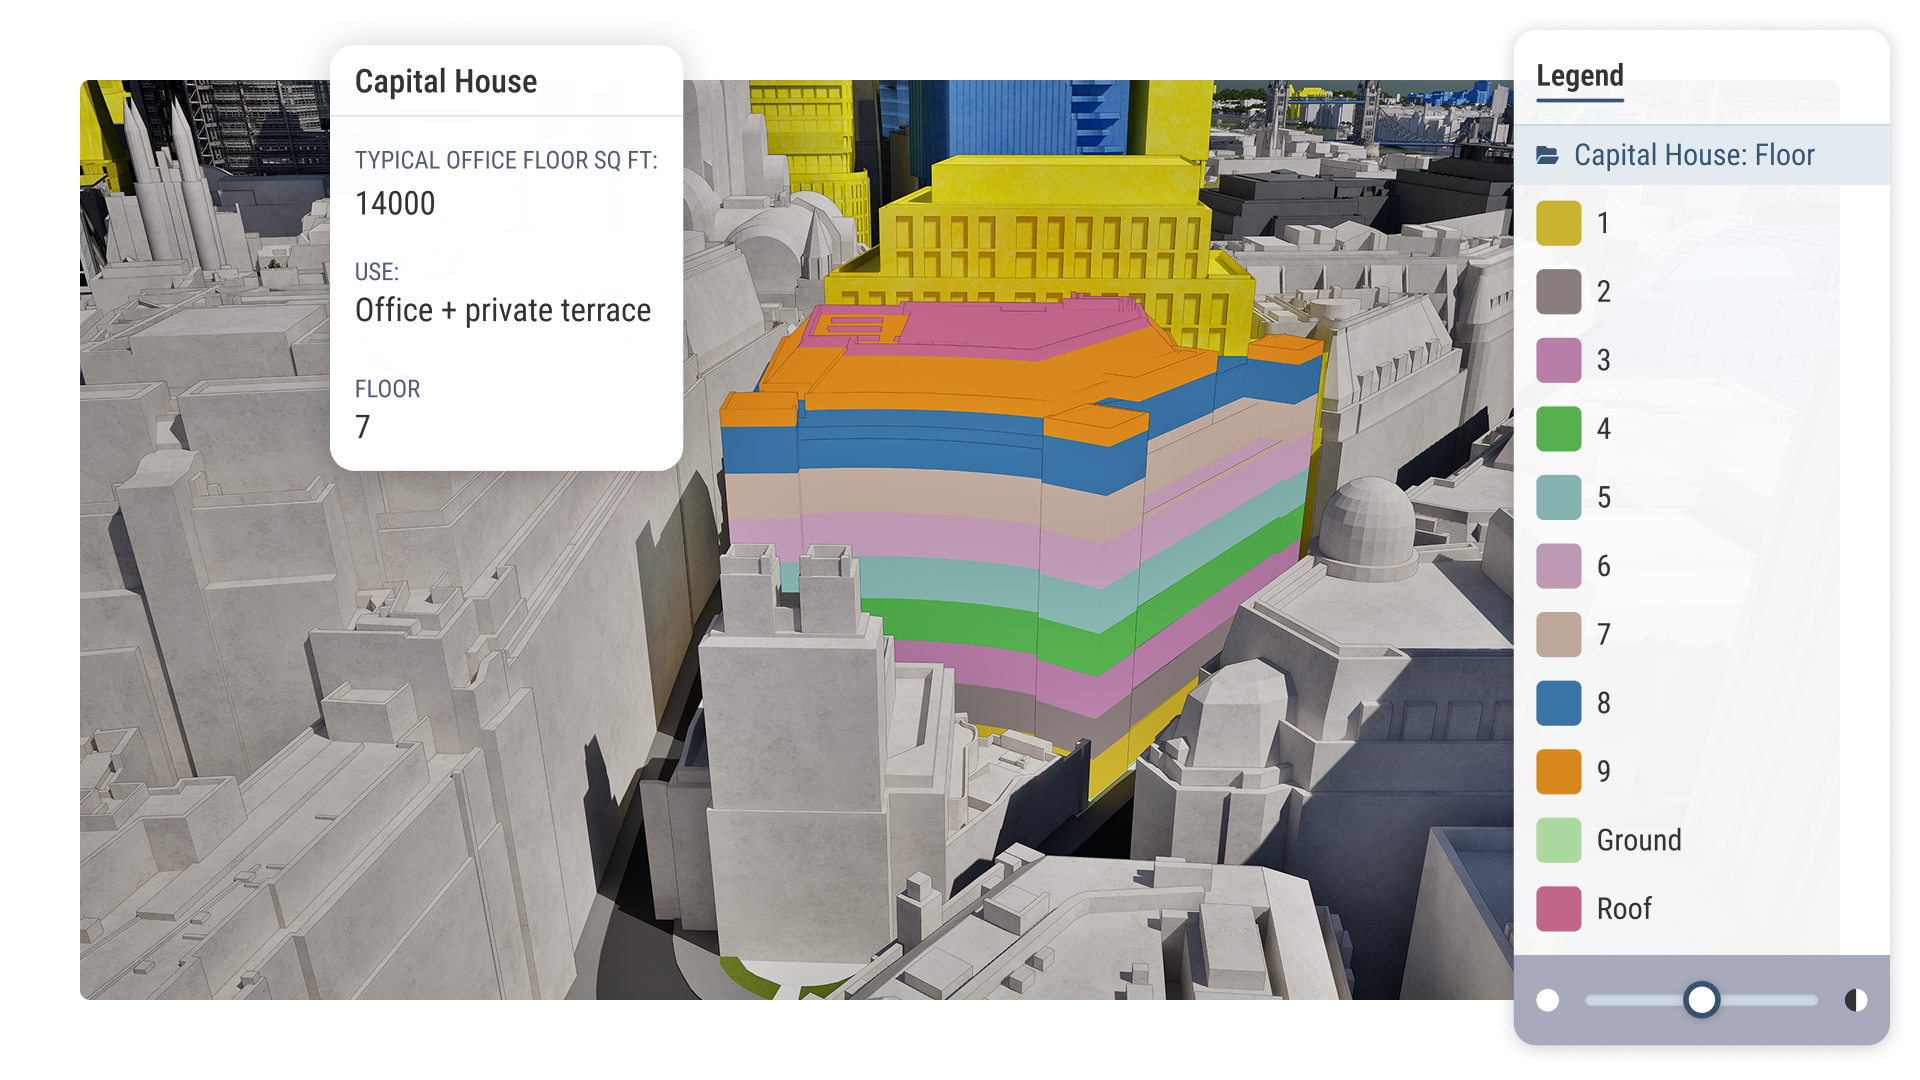
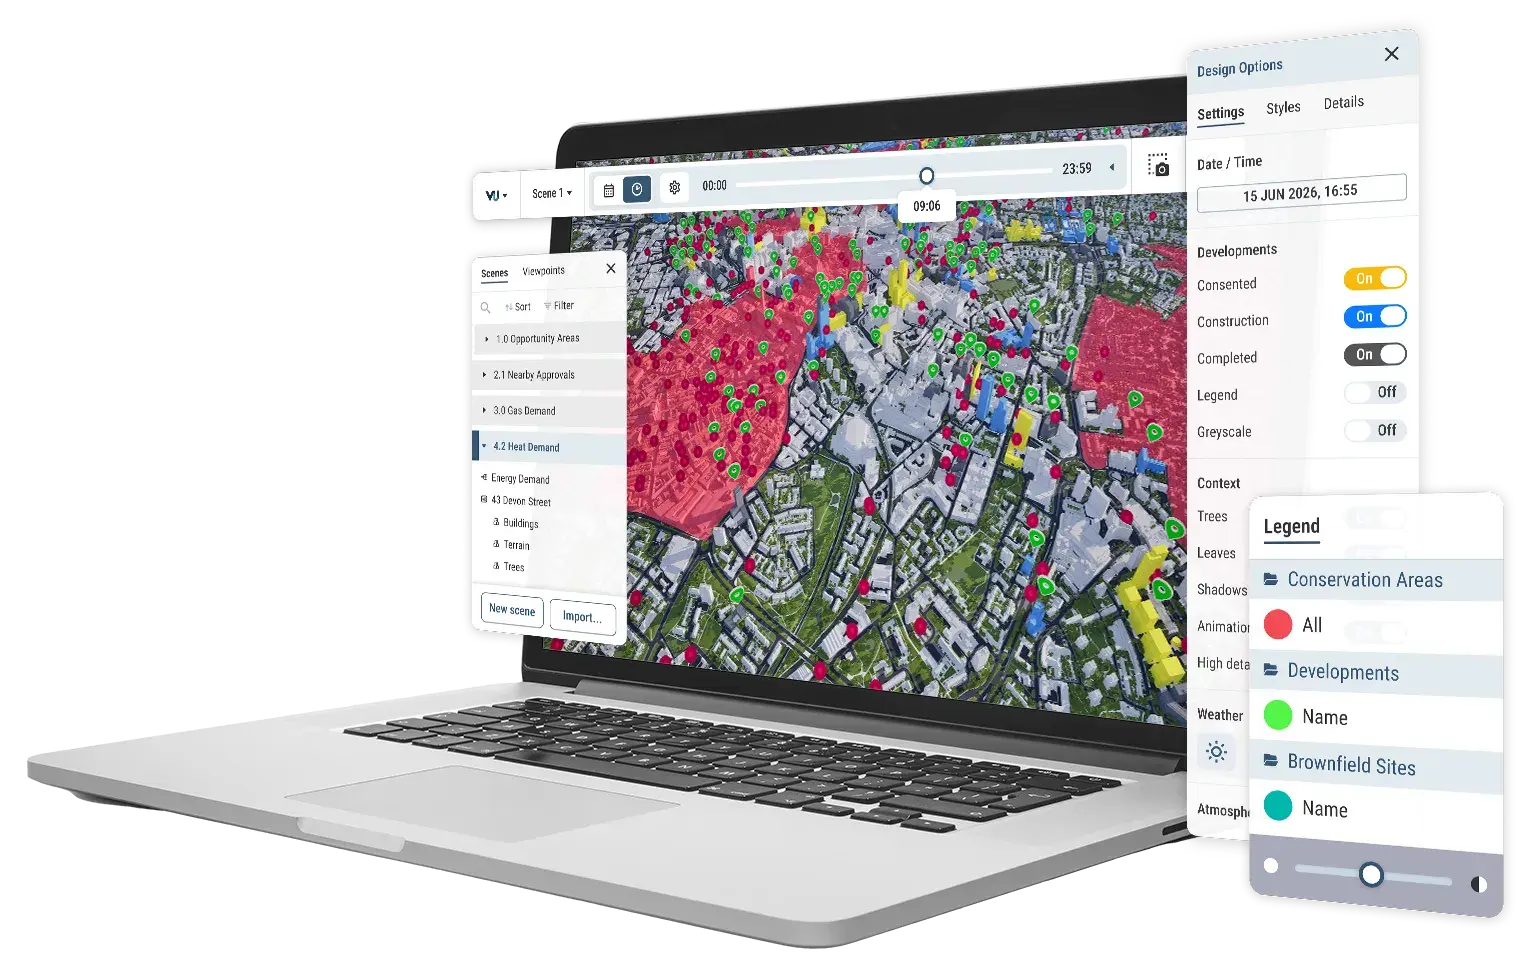
See every approved and under-construction building automatically added to the model around your assets. Spot how a changing area could affect value, occupancy or risk well before it shows up in performance data.
Custom data layers
Bring in your own portfolio data, plus third party sources, to visualise transactions, lease terms, ROI, maintenance schedules or anything else that matters to your strategy.
4D forecasting toolkit
See how areas and assets have changed across the past, present and future. Use this context to make more accurate forecasts on value, returns and risk.
Portfolio filtering and highlighting
Plot your entire portfolio on the map and filter instantly by the criteria that matter, location, asset type, performance or risk, so you can identify priorities at a glance.
Quick Capture and imagery export
Generate high-quality stills and visuals straight from the platform for investor reports, board presentations and stakeholder updates, without briefing a design team.
Data Lab: AI-powered data query
Ask questions in plain language and get answers across your own data and our public library in seconds. Just ask, and cross-reference instantly.
Streamlined workflows with your AI assistant
Analyse data in seconds using VU.CITY Data Lab. Query ROI and consented development across your portfolio instantly, so every investment decision has the evidence behind it.
Join a community of 6000+ users across 200+ organisations
Property asset manager FAQ
Frequently asked questions from property asset manager using VU.CITY.
How can I see my property portfolio in VU.CITY?
You can plot your managed assets and their surrounding areas on an accurate 3D city map, view consented and under-construction developments nearby, and filter your portfolio against any data you bring in.
Can I use a 3D mapping platform to scope new acquisitions or redevelopment opportunities?
Yes. You can build contextual views of a site or area, including surrounding GIS data, the consented development timeline and any of your own data, without needing a dedicated GIS team to do it for you.
How do I find out if planning changes nearby could affect an asset's value?
VU.CITY automatically tracks publicly available planning data and adds approved and under-construction buildings to the model, so you can see how an area is changing and flag potential risk or opportunity early.
Can I bring my own portfolio, leasing or financial data into a property visualisation platform?
Yes. You can upload your own data alongside VU.CITY's public data library, then filter and present it however suits the brief, whether that's lease terms, ROI, maintenance schedules or asset condition.
Is uploaded portfolio data kept private?
Yes. Your uploaded data stays private to your organisation, and you control who within your own team can see it.
How can I present a portfolio strategy or forecast to investors with VU.CITY?
You can easily build immersive, interactive presentations that show forecasts, area context and asset performance visually, rather than relying on static dashboards or slide decks alone.
Can I query my data without needing technical or GIS skills?
Yes. Our Data Lab lets you ask questions in natural language across your own data and our public library, so you can get answers without writing a query or relying on a specialist.





.svg)

.svg)
.svg)
.svg)

.svg)
.svg)


.svg)


.svg)
.svg)
.svg)

.svg)


.svg)
.svg)