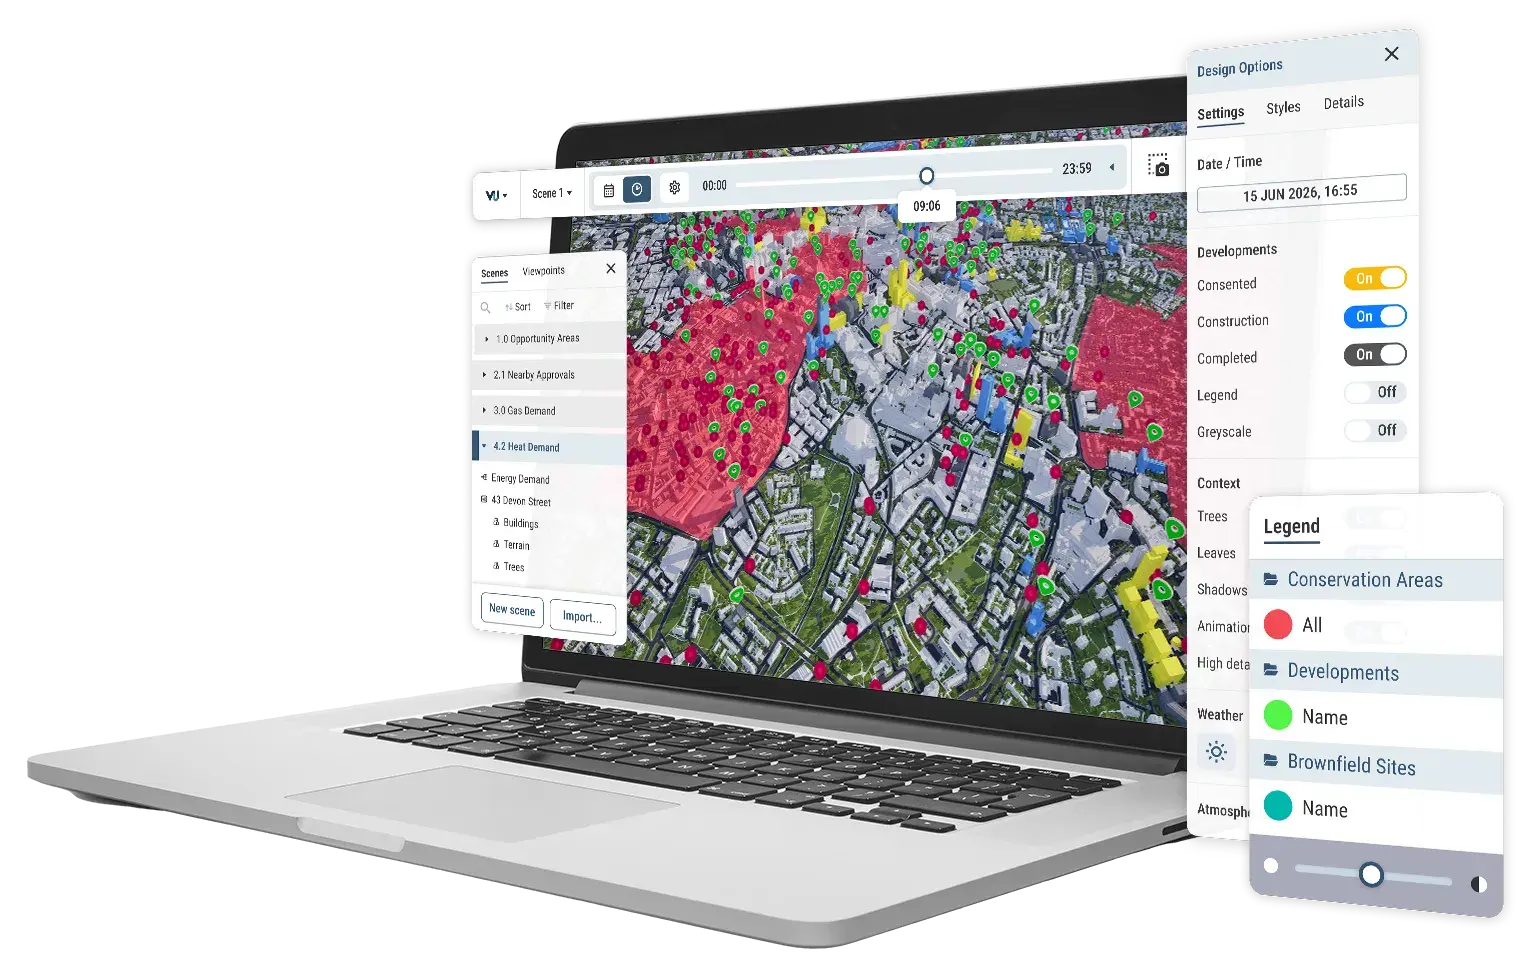





Models
The most accurate and detailed managed city models in the UK&I. Over 3,500km² of coverage.

Tools
Integrated planning, analysis and presentation tools, all in one collaborative platform.

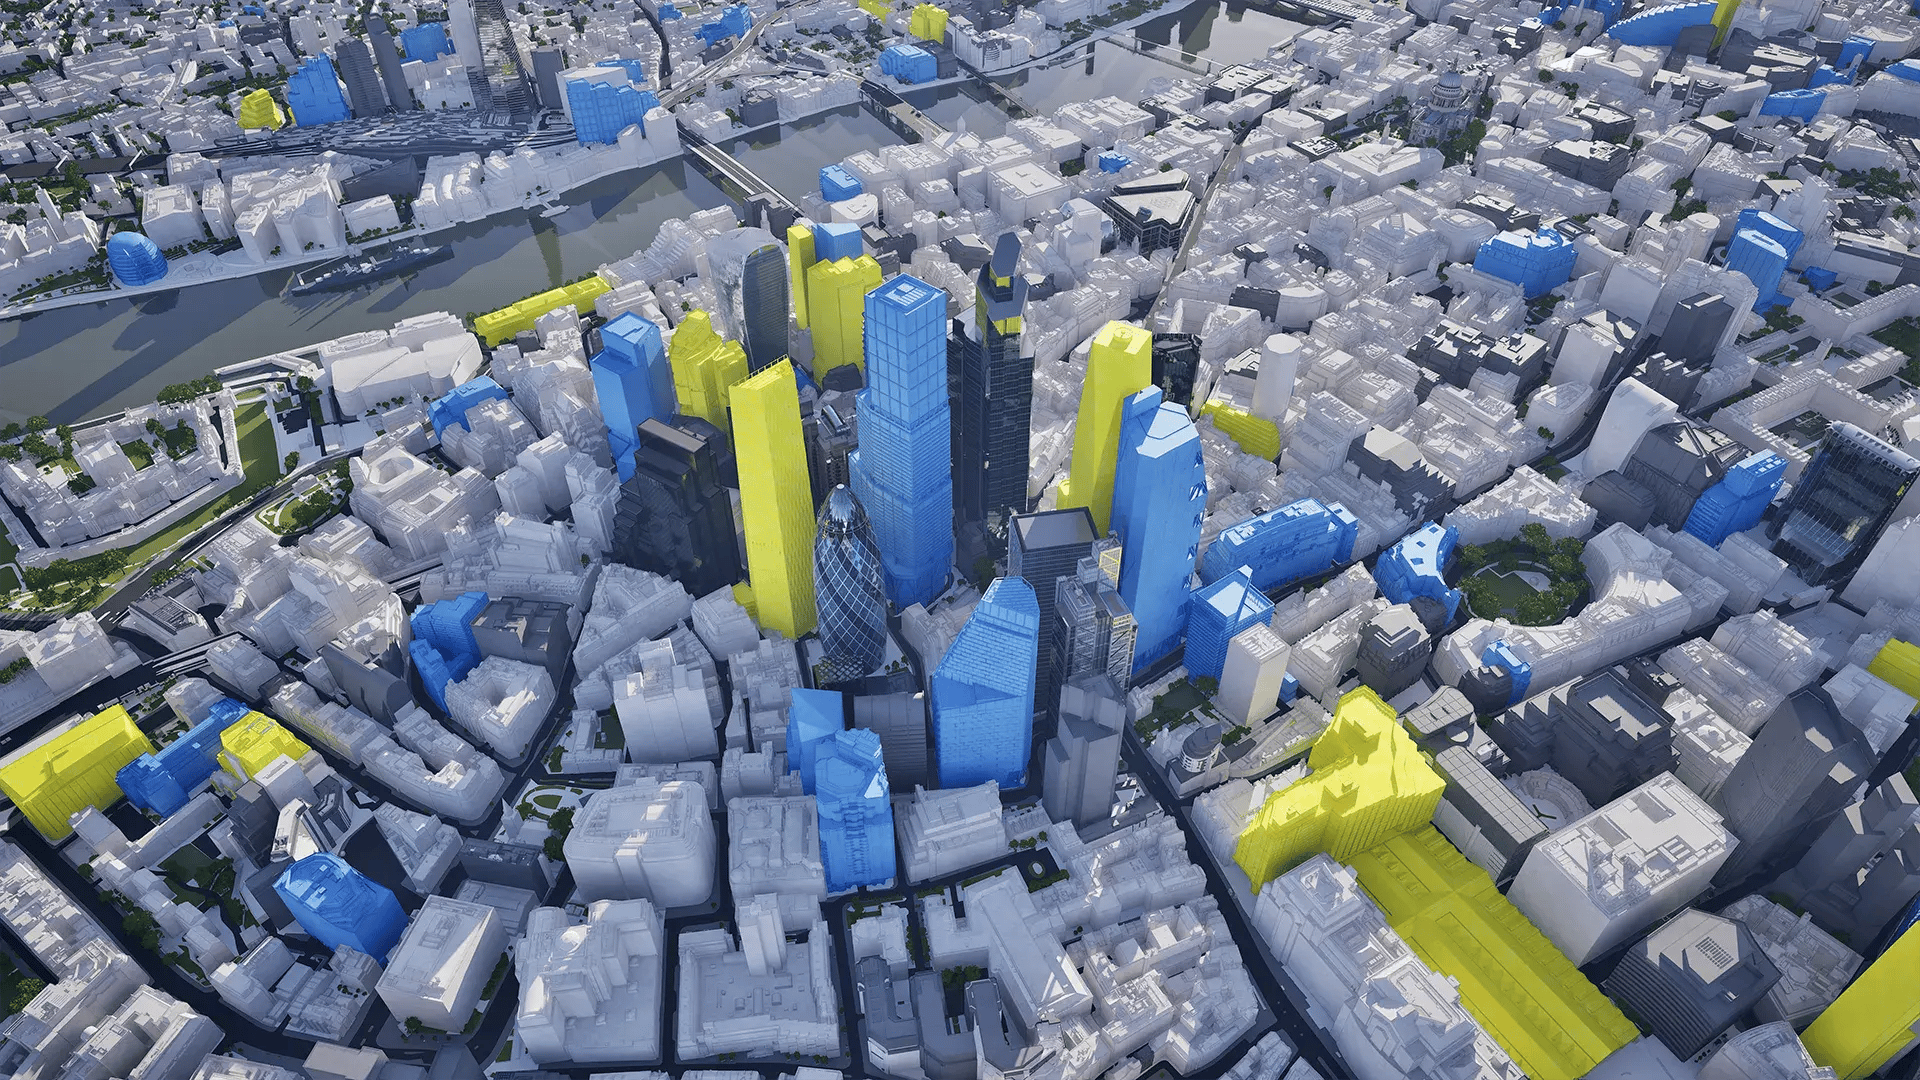 London 2016
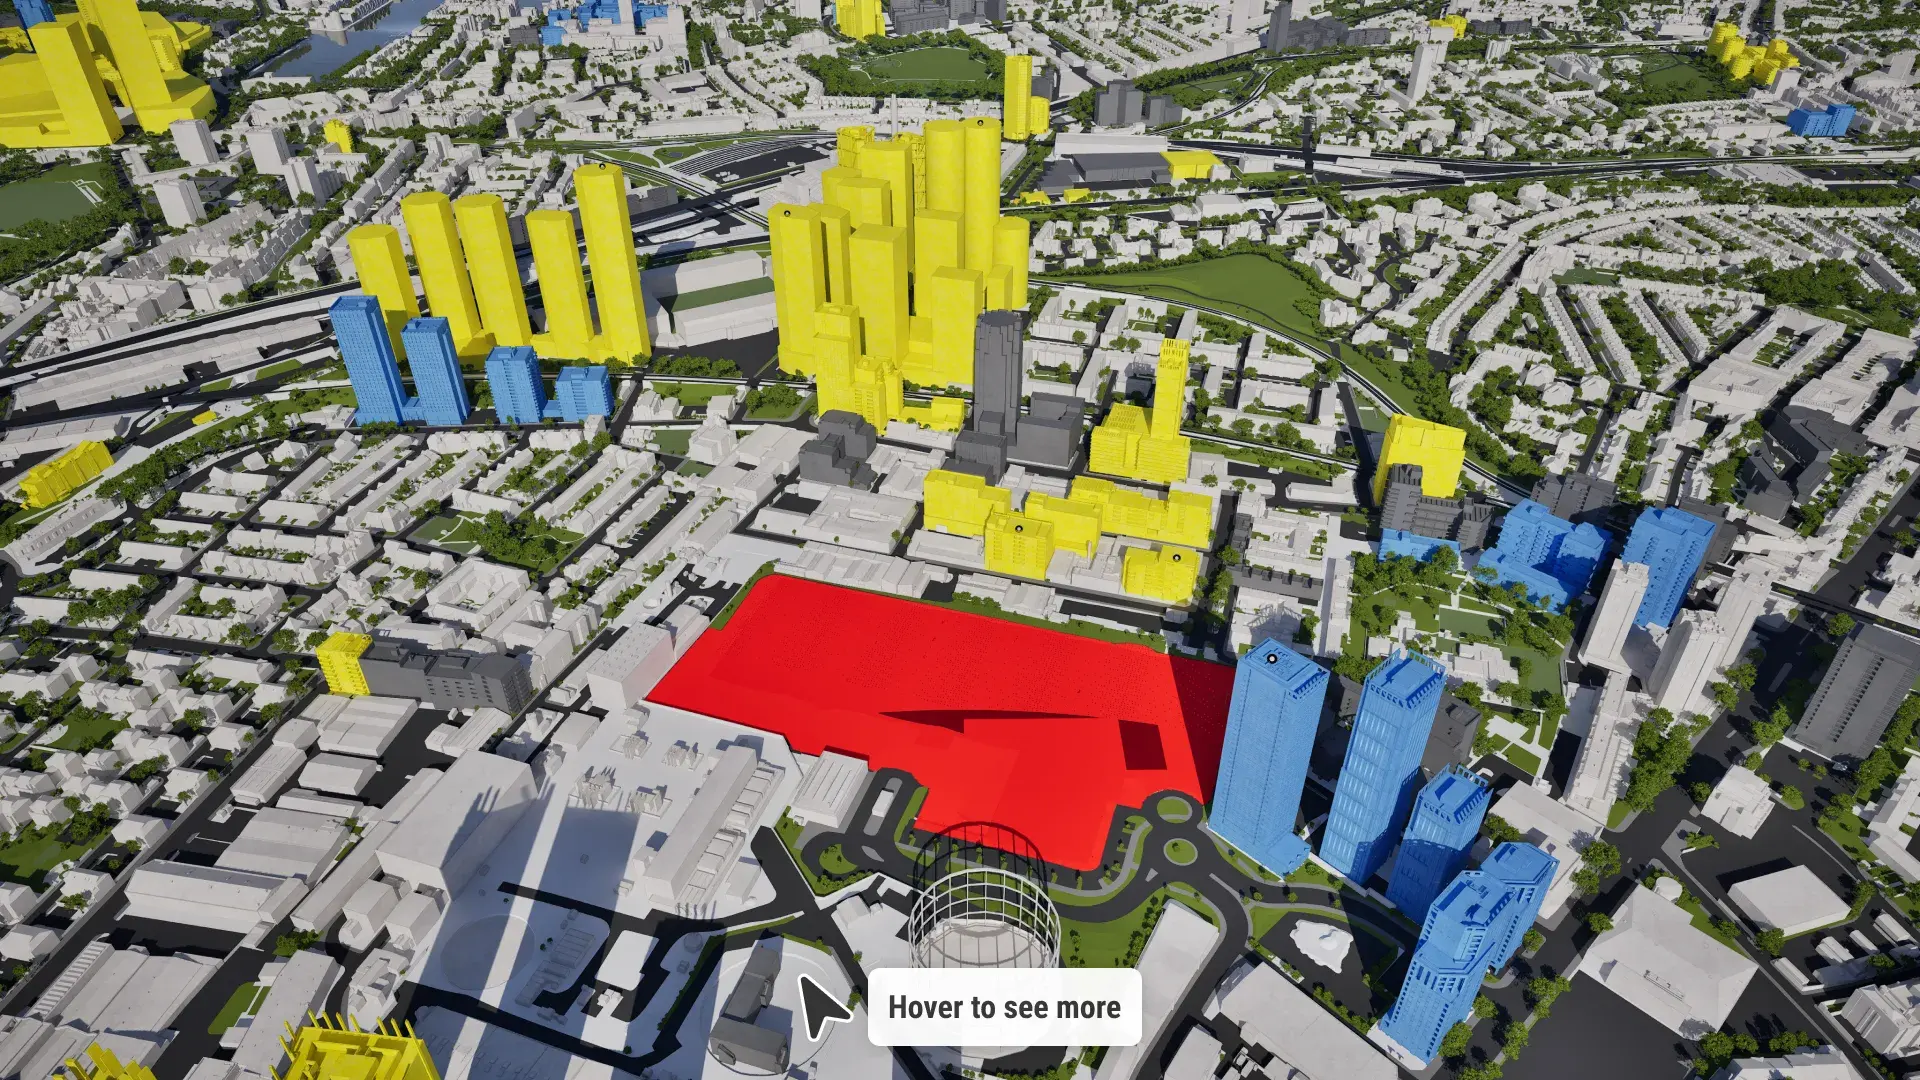
London 2027
London 2016
London 2027
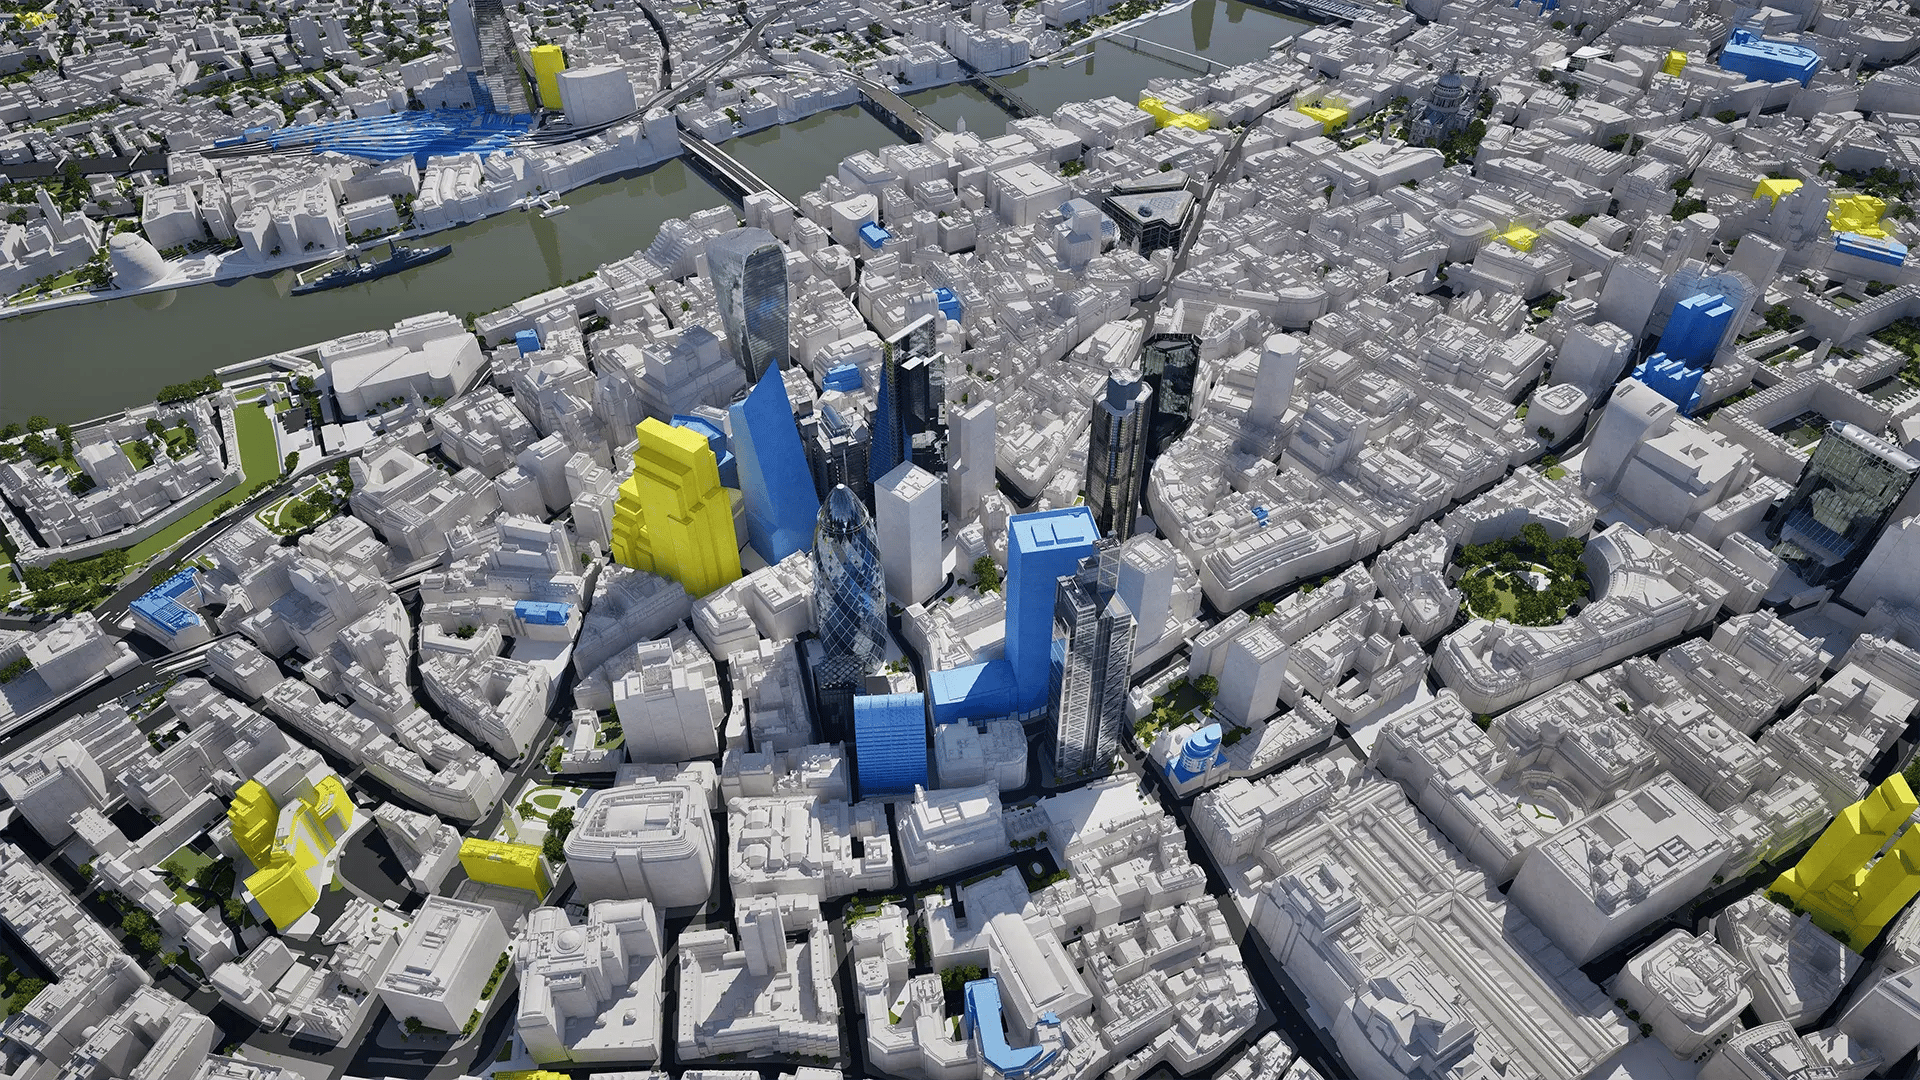
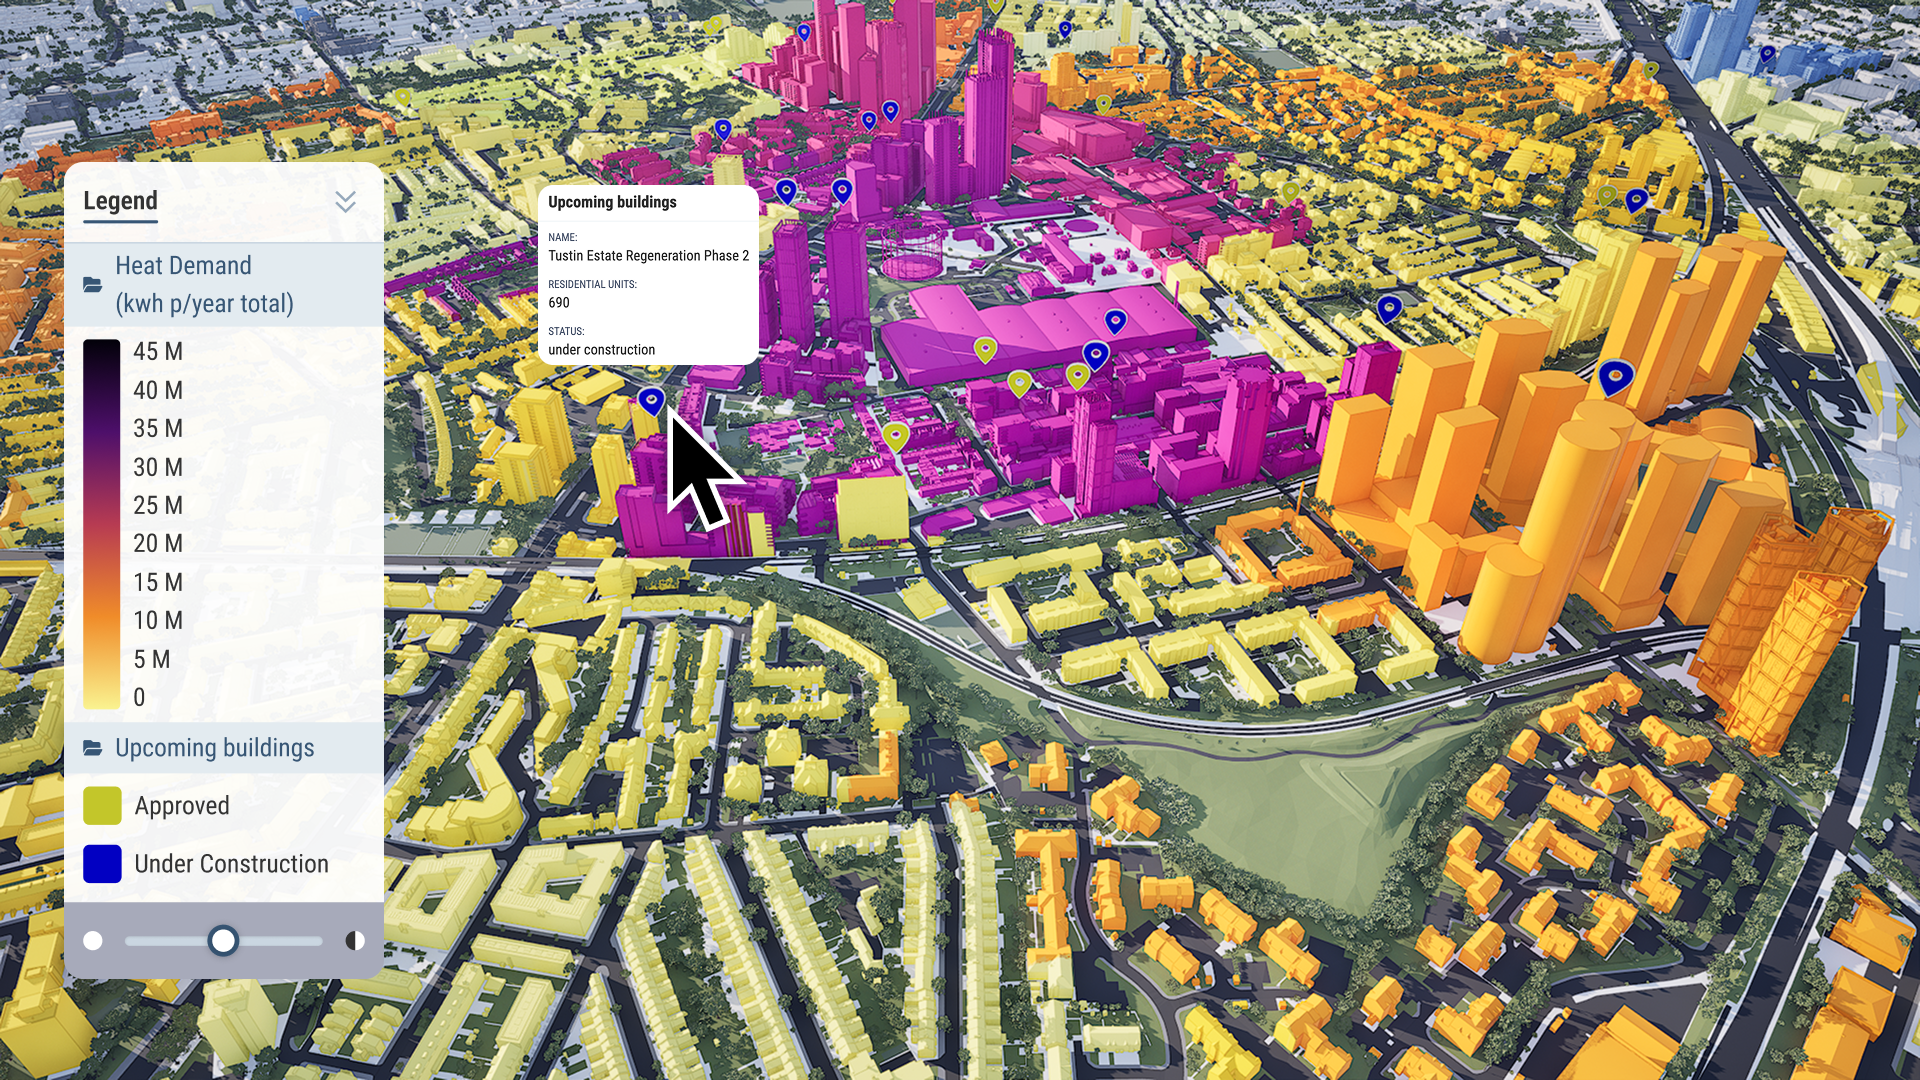
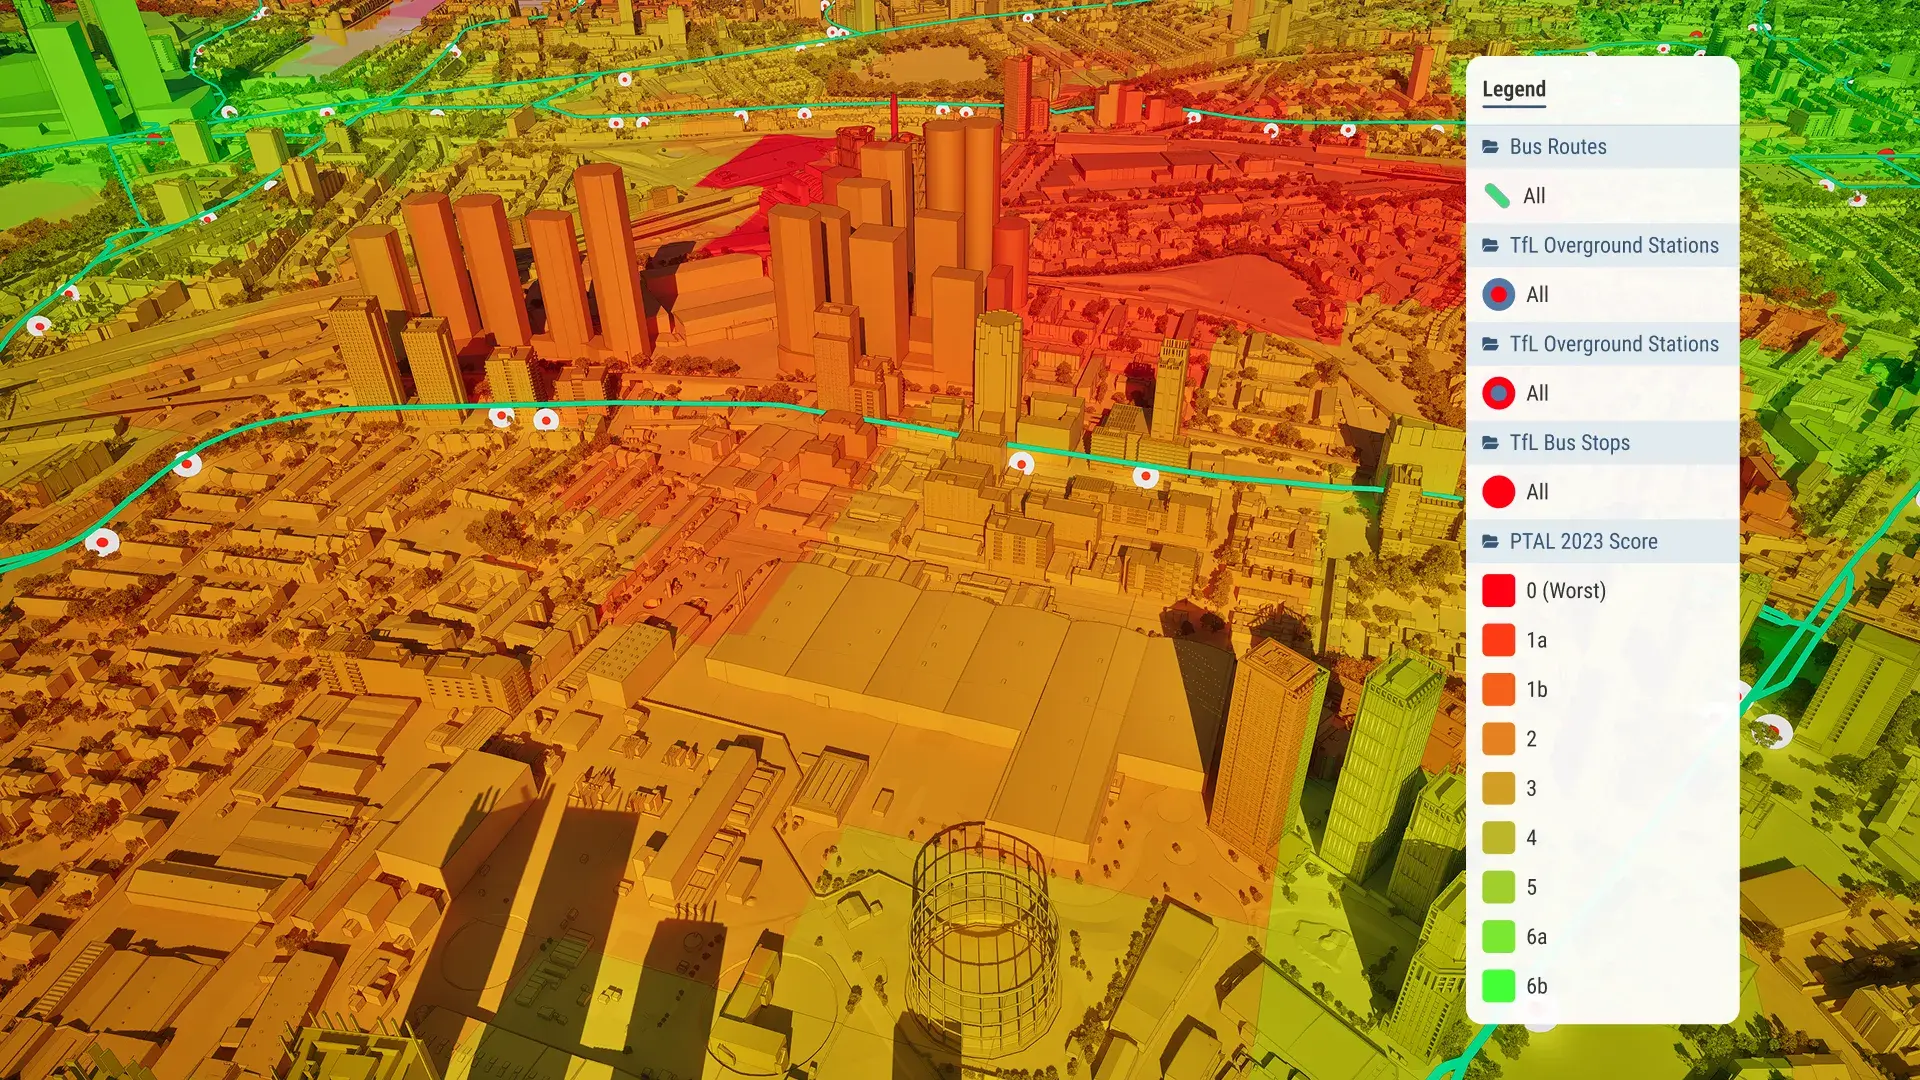
Powerful data visualisation
VU.CITY is the fastest and most seamless web-based platform for visualising, filtering and styling large-scale data sets. Combine and layer data from any source. Say goodbye to long load times.
.jpg?width=1920&height=1080&name=Transport%20TfL%20Walk%20Times%20Santander%20Cycles%20Zone%201%20(1).jpg)
Every data type, for every workflow
Our platform allows you to seamlessly combine BIM and GIS data in a single view. Visualise any type of GIS and spatial data, including points, lines, areas, mesh, raster and time series.
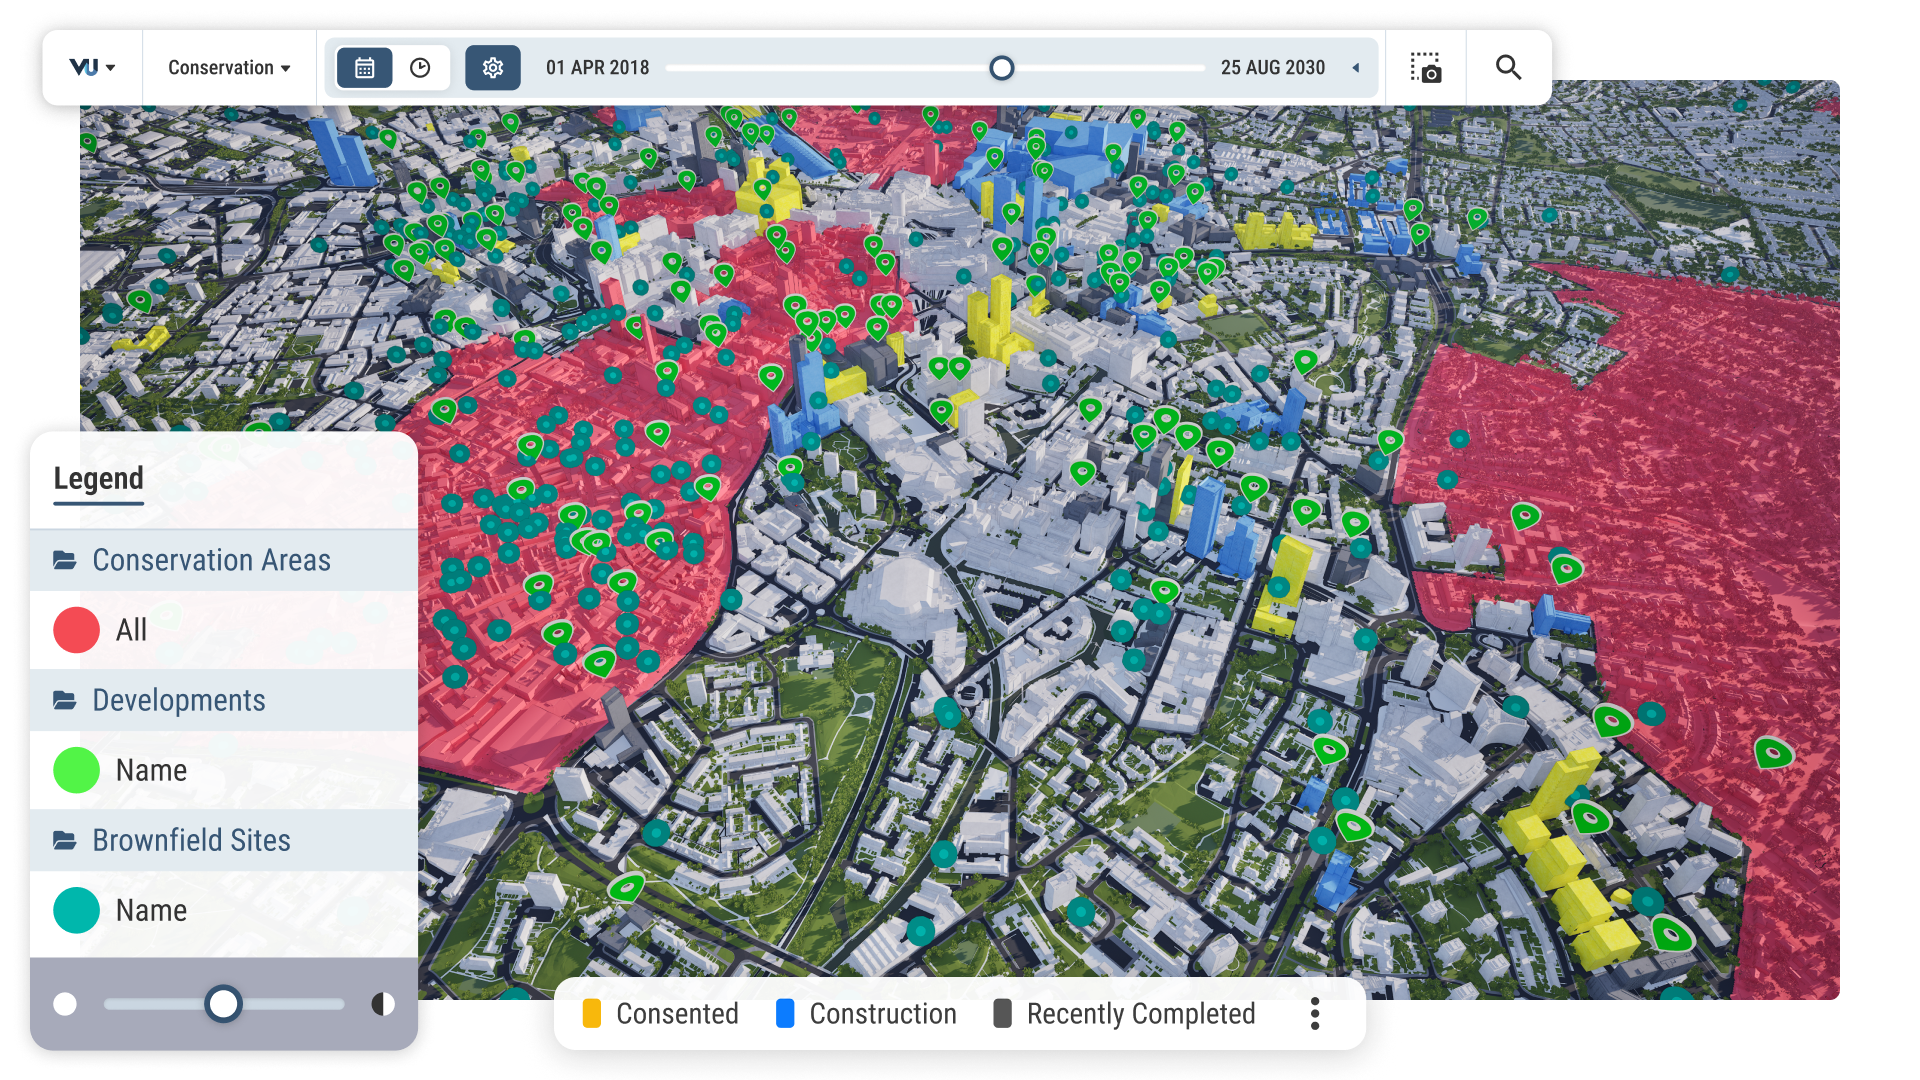
VU.CITY Public Library
From local policy, to demographics, climate and amenities, our public library includes a wealth of data across every city.
.gif?width=1152&height=648&name=download%20(1).gif)
Verified feedback and curation
Every user benefits from our data curation and the feedback of verified key players that shape the built environment: Local government, planning consultants and architects.
Coverage across 26 UK & International cities


Join a community of 6000+ users across 200+ organisations