3D Data Visualisation Tools
Understand the feasibility and impact of your scheme with planning data layers that are relevant to each city, from public and private sector sources.


Explore VU.CITY's 3D data layers
VU.CITY helps you visualise, organise and analyse data clearly and easily so that everyone involved can make better and quicker decisions.
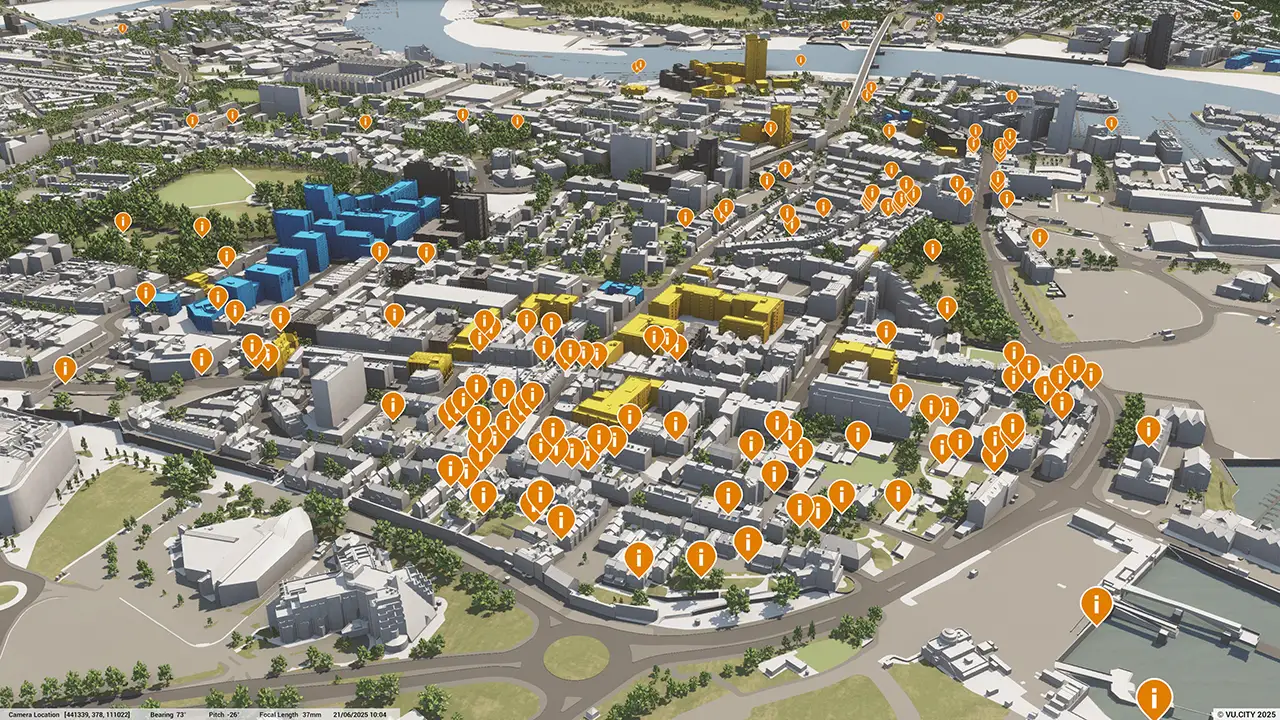
Explore the amenities that surround your project.
From retail boundaries, to supermarkets, hospitals, GPs, police stations and more.
VU.CITY Belfast Primary Retail Frontage
Understand local demographics at a glance.
Access population, age, household and income data to inform design and planning strategies.
VU.CITY Oxford Population Density
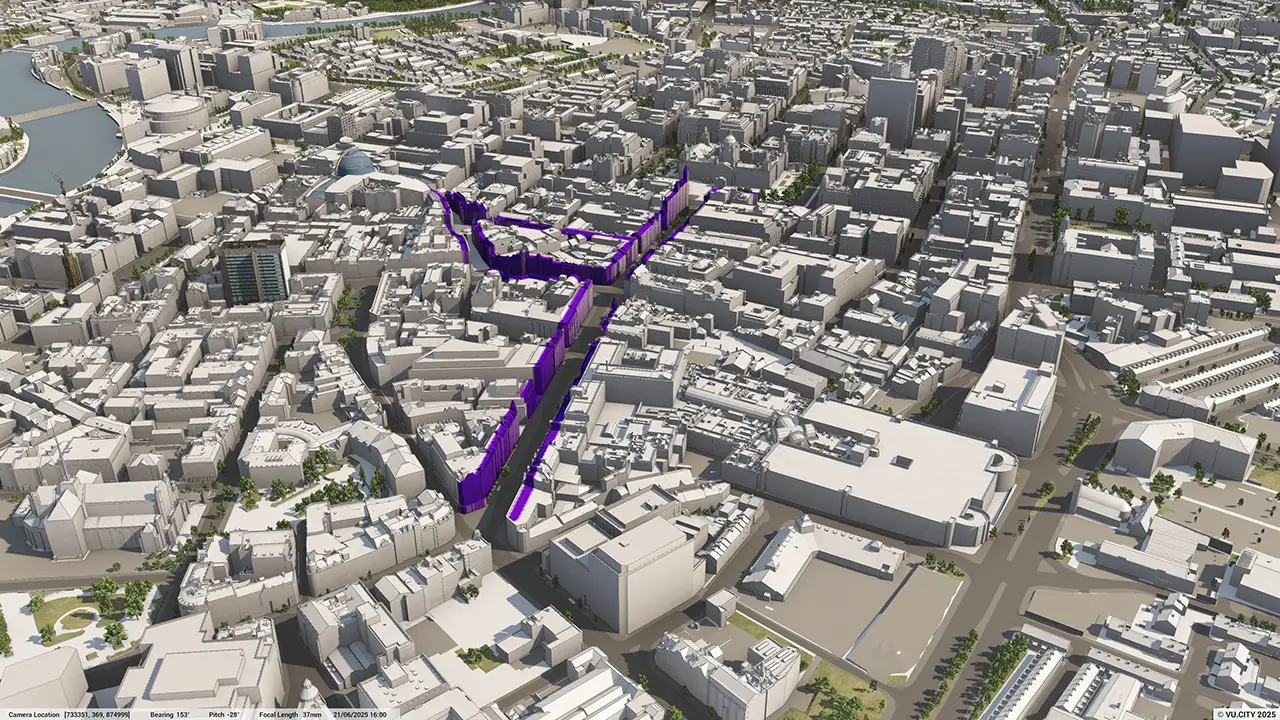
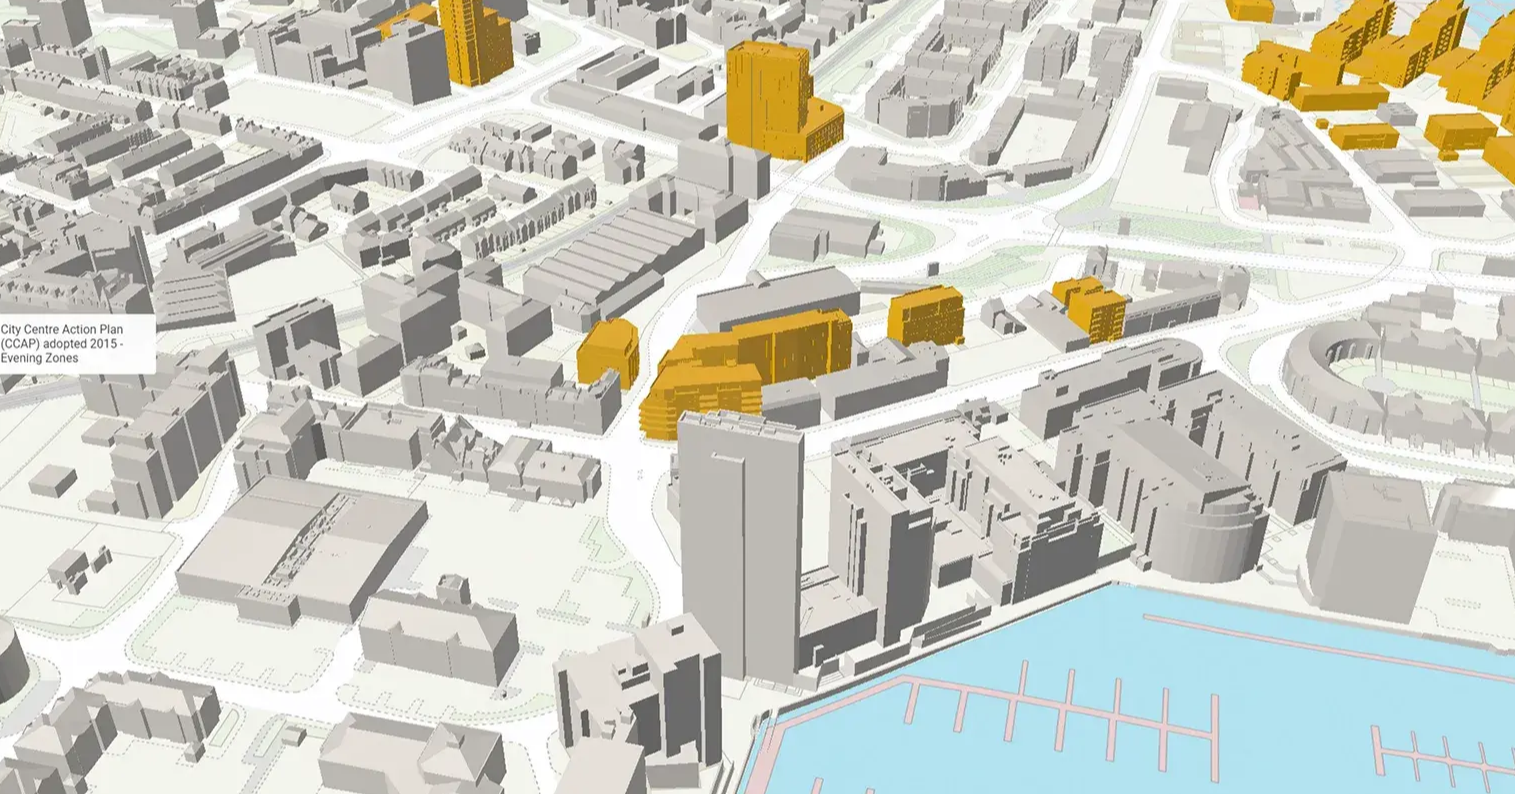
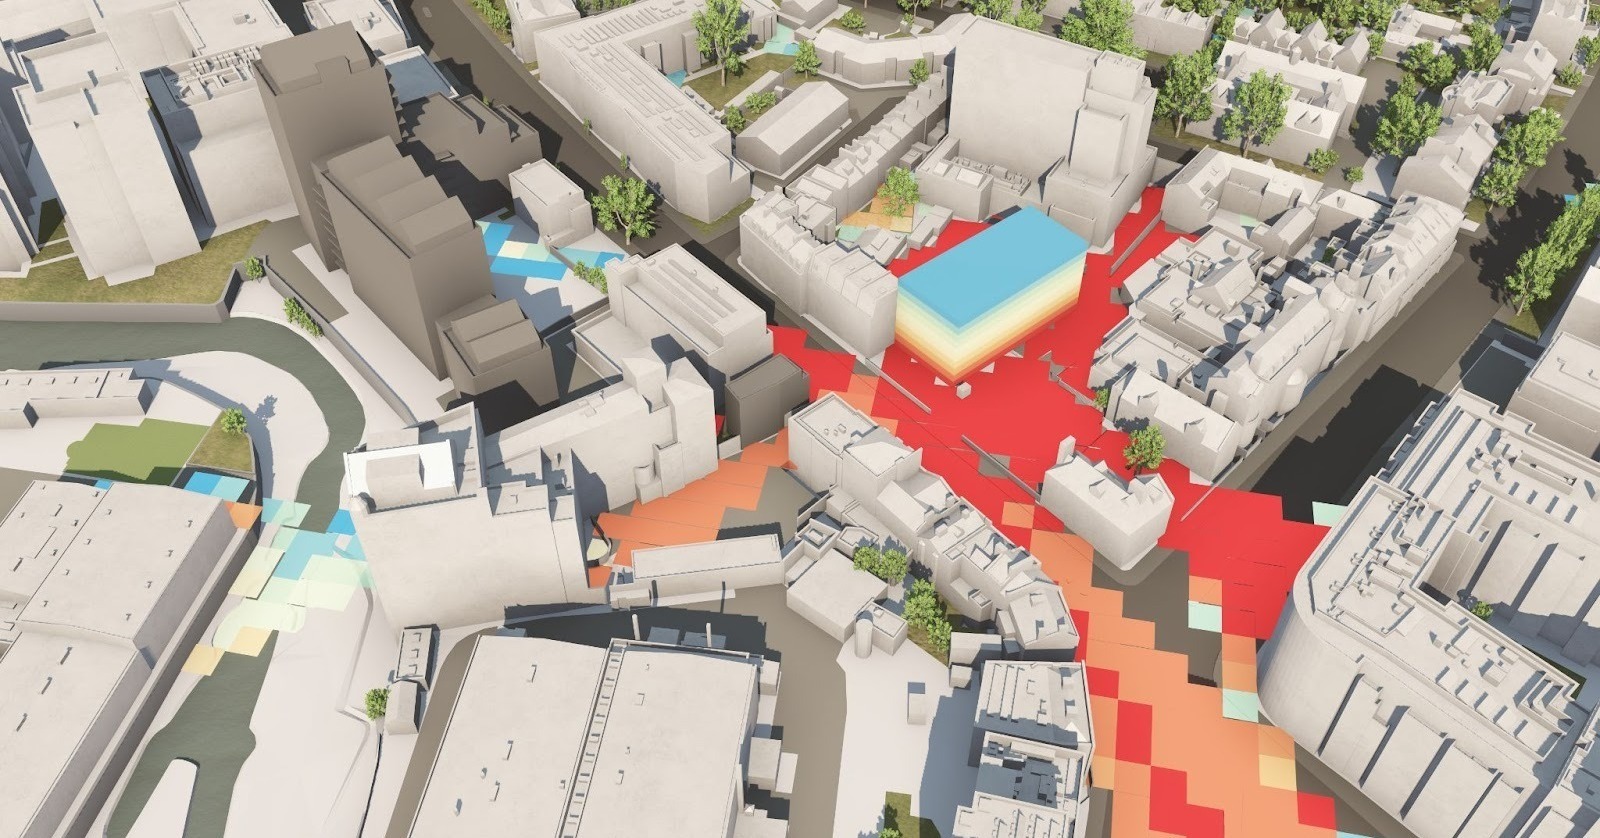
Visualise crime data to support safety-led design.
Analyse crime rates and incident locations to shape safer public spaces and enhance proposals.
VU.CITY London Crime - Theft from Person
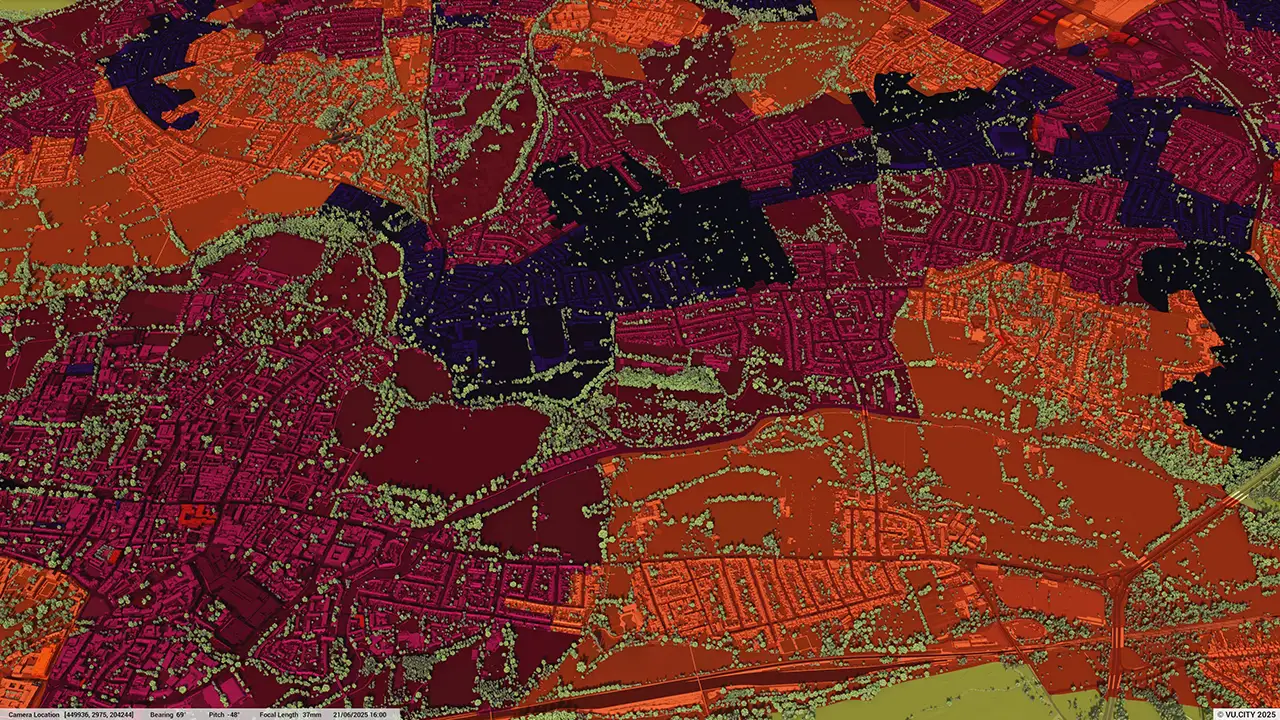
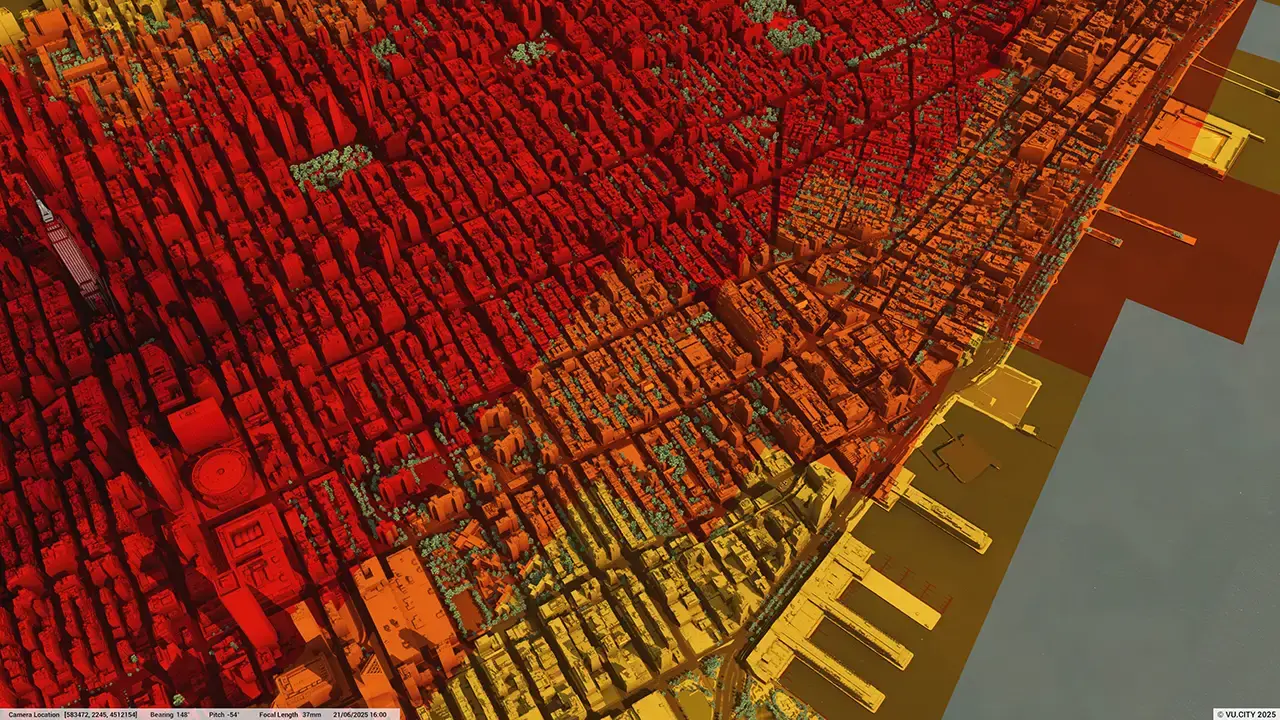
Plan responsibly with environmental data.
View flood zones, green spaces, biodiversity and air quality to future-proof your proposals.
VU.CITY New York Air Pollution
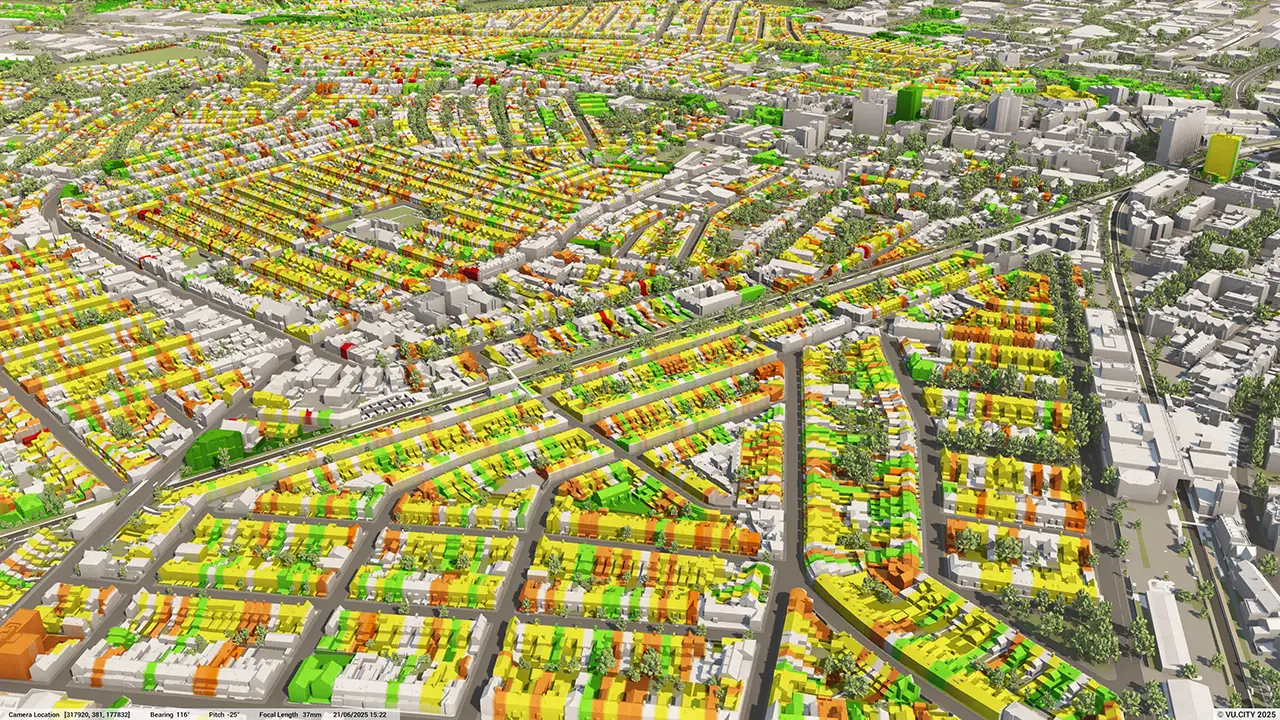
Evaluate building energy performance.
See EPC ratings across nearby buildings to support sustainability strategies and retrofitting plans.
VU.CITY Cardiff EPC - Domestic
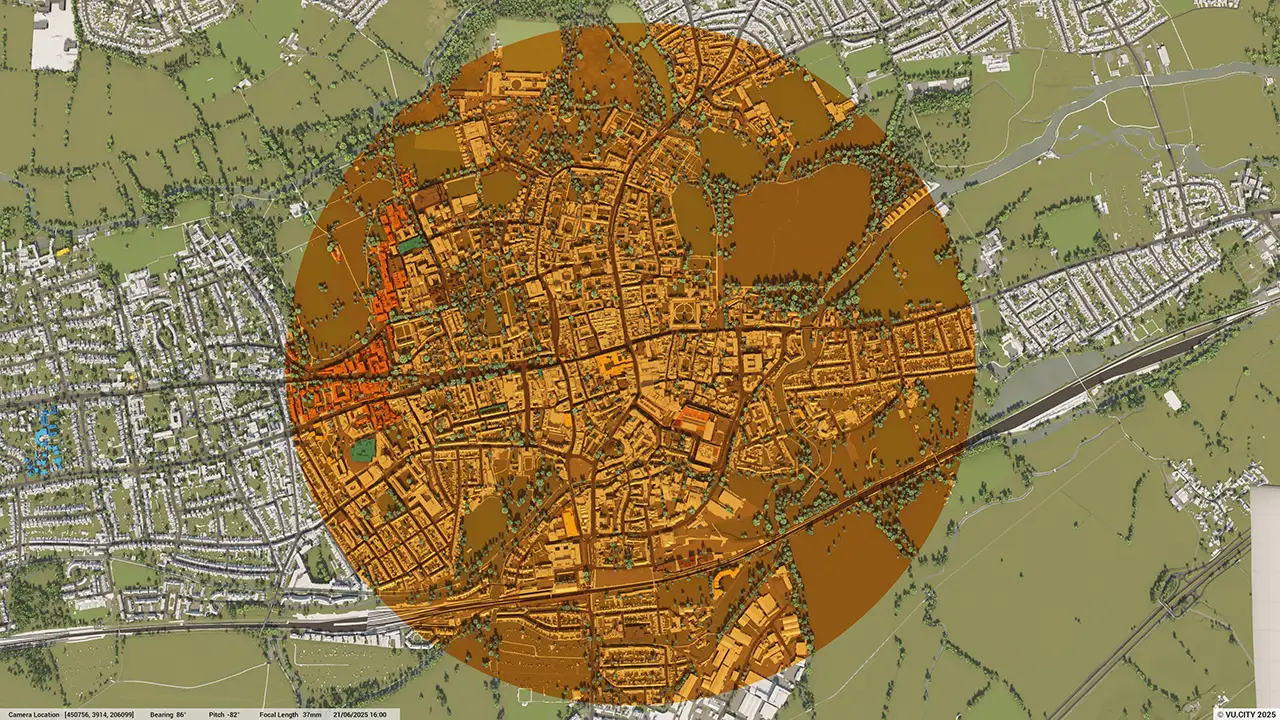
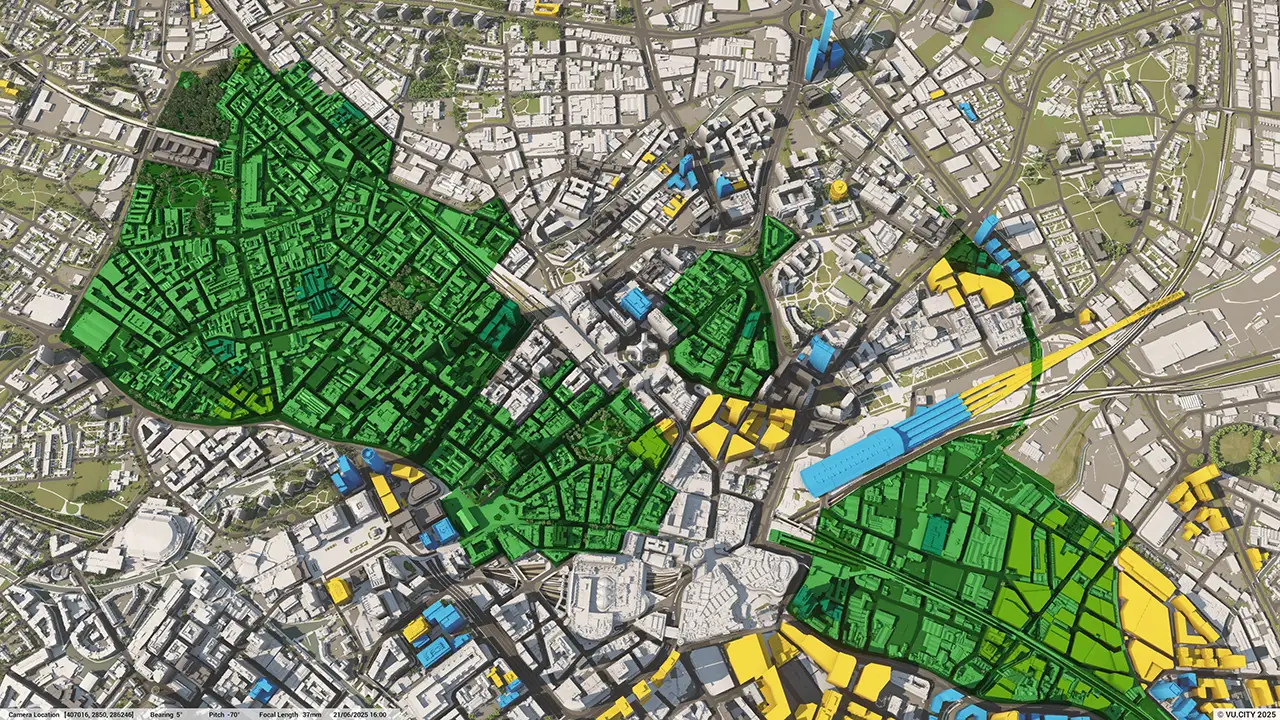
Identify local historic context and conservation areas.
Layer historic mapping and boundaries to protect heritage and comply with planning policy.
VU.CITY Oxford DH2 Views - Historic Core Area
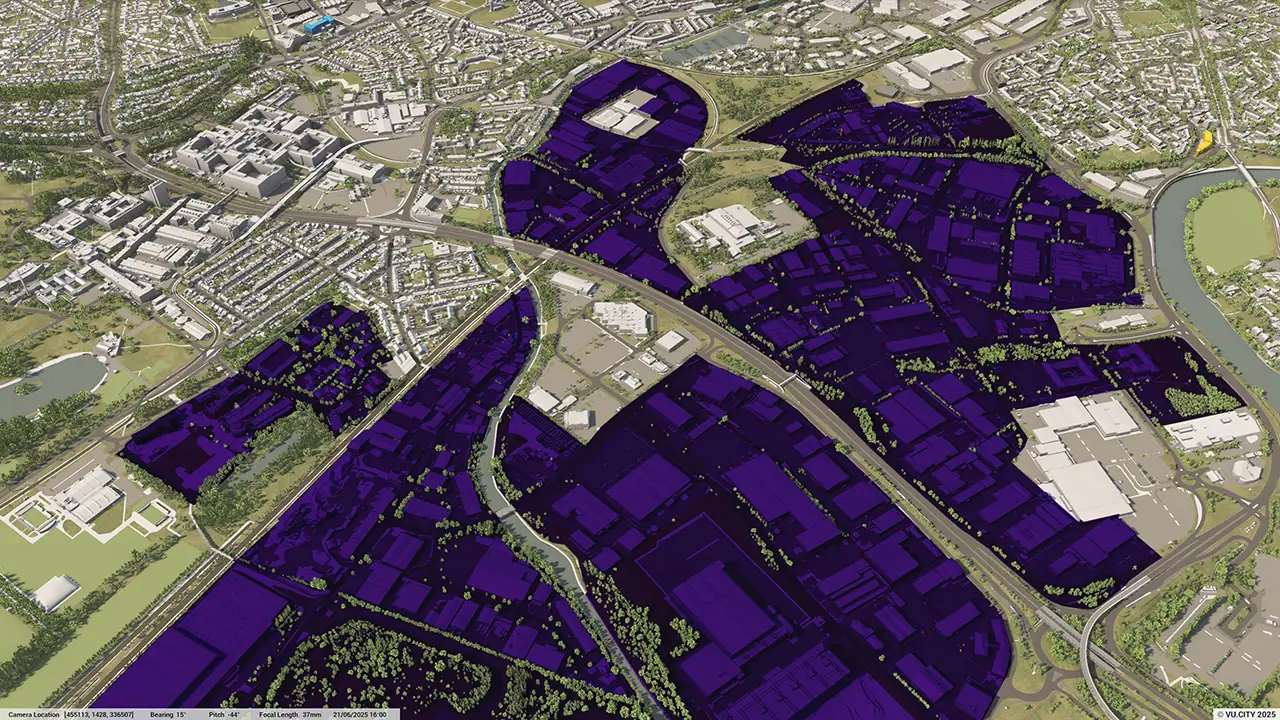
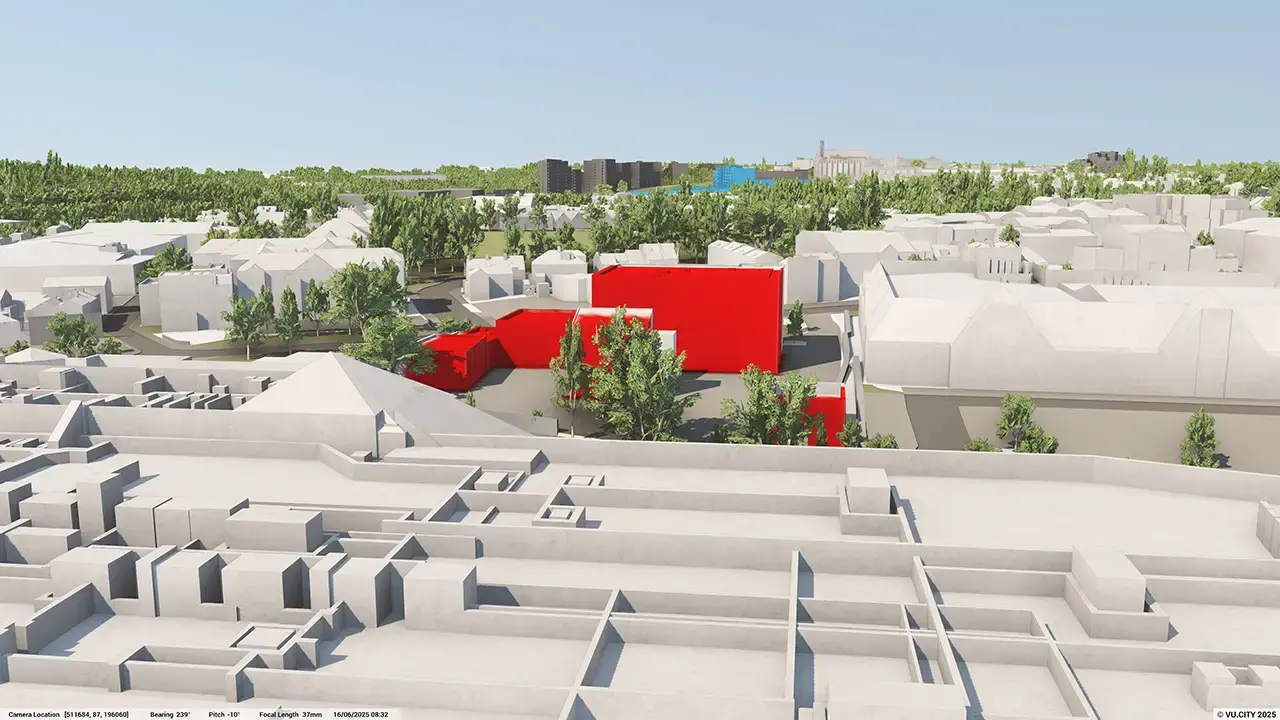
Spot industrial use sites for Brownfield or co-location opportunities.
Overlay industrial land use data to identify redevelopment sites or buffer zones.
VU.CITY Nottingham Major Business Parks and Industrial Estates
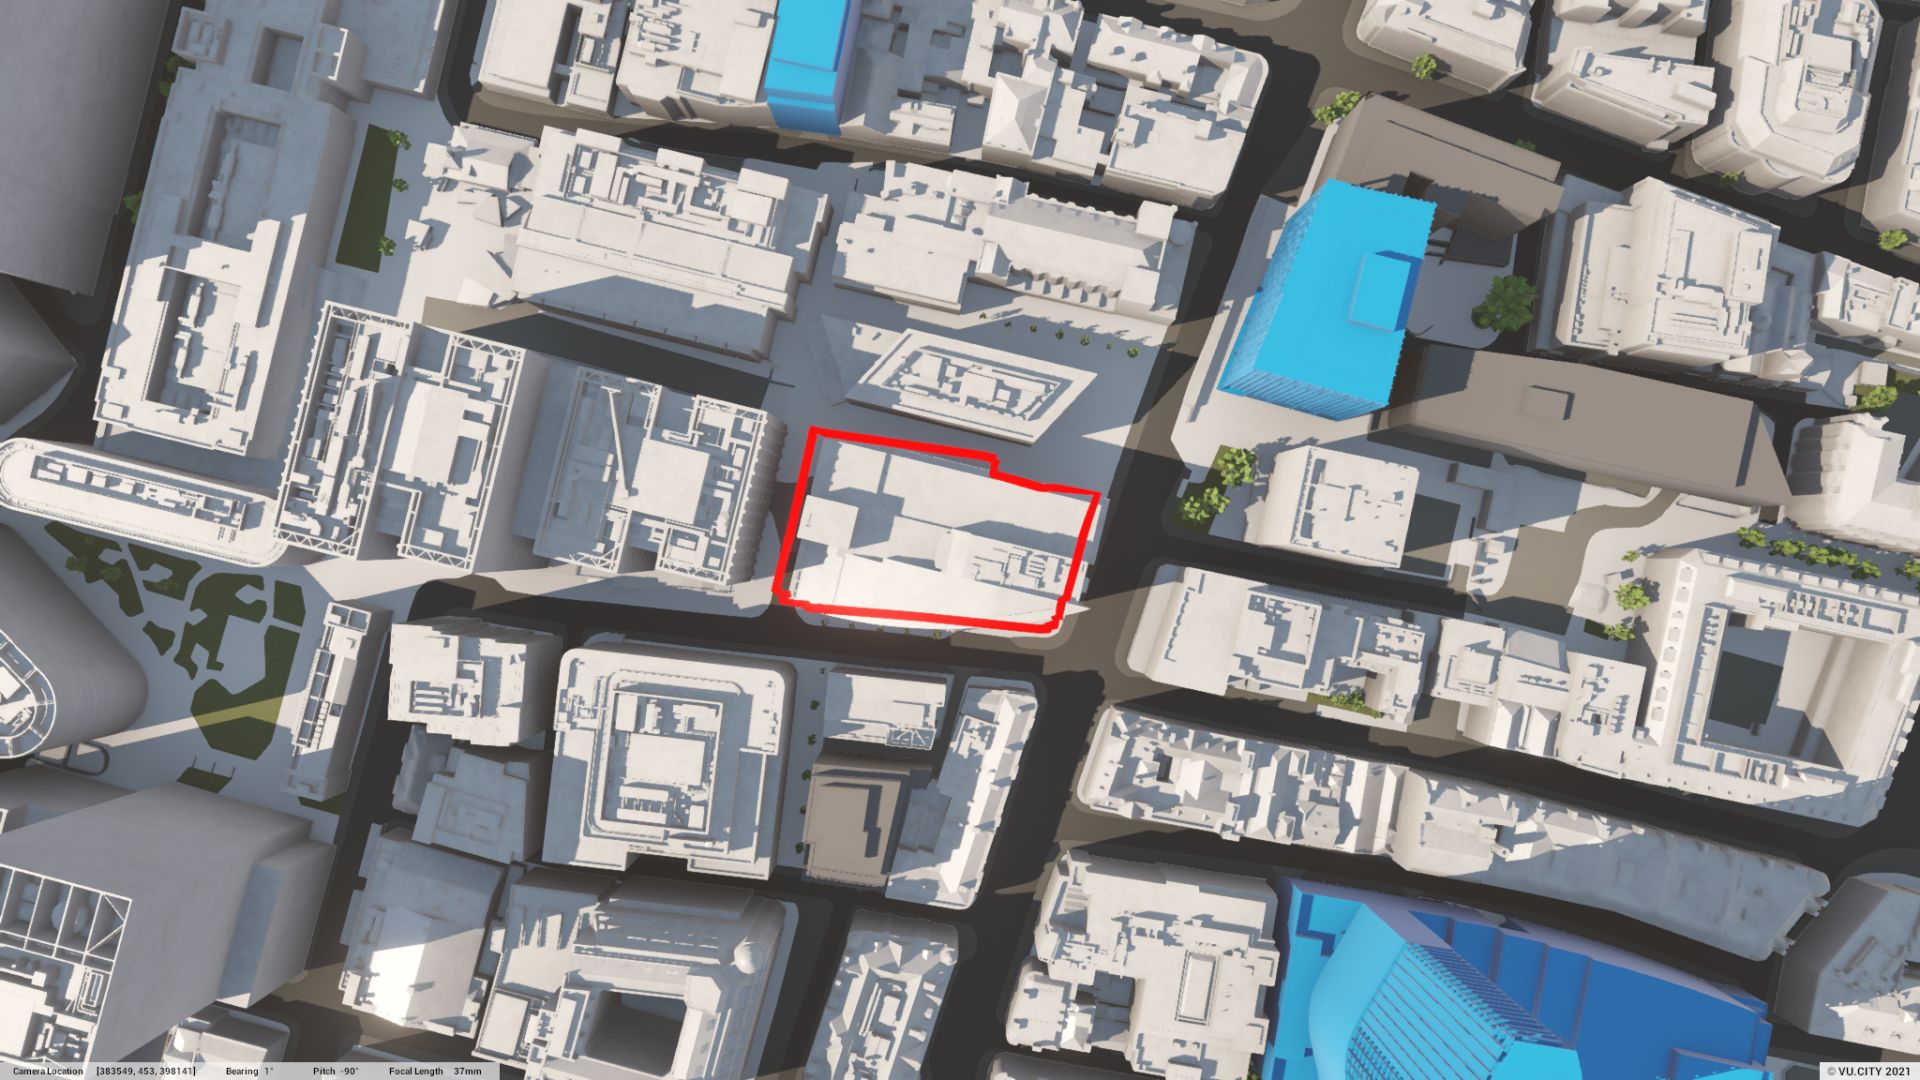
Access ownership information instantly.
See freehold and leasehold boundaries to understand ownership, risk and opportunity.
VU.CITY Manchester Land Registry Query
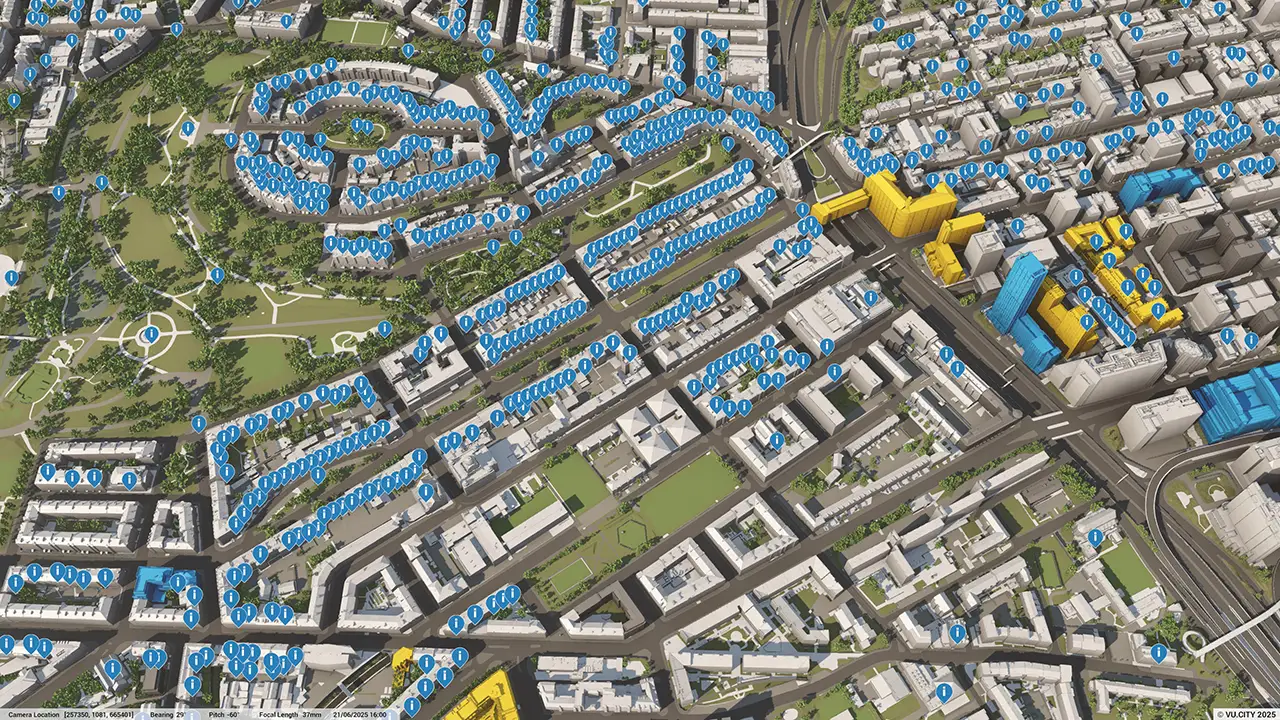
Flag heritage assets with Listed status.
Identify protected buildings within and around your site to assess planning constraints.
VU.CITY Southampton Listed Building Points
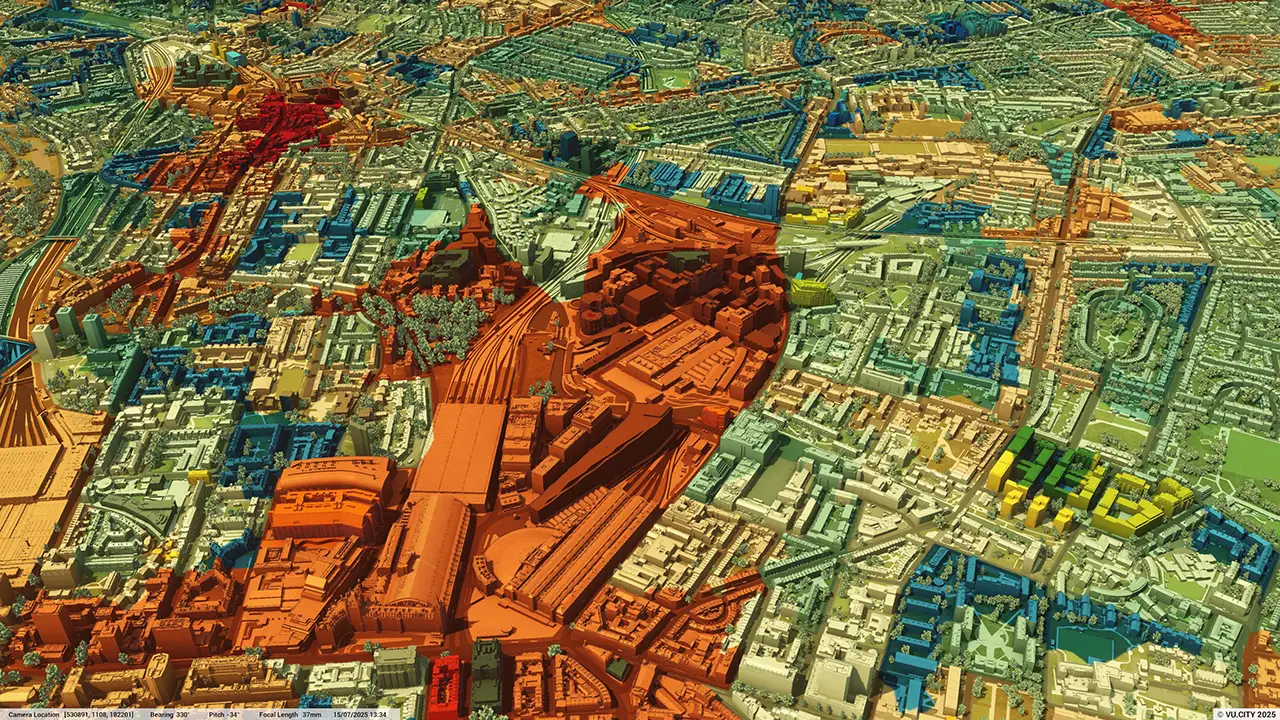
See past and present planning applications.
Review planning history and live applications to support feasibility studies and due diligence.
VU.CITY Birmingham Conservation Areas
Locate landmarks, attractions, institutions and community hubs to understand place character.
VU.CITY Watford Fire Stations
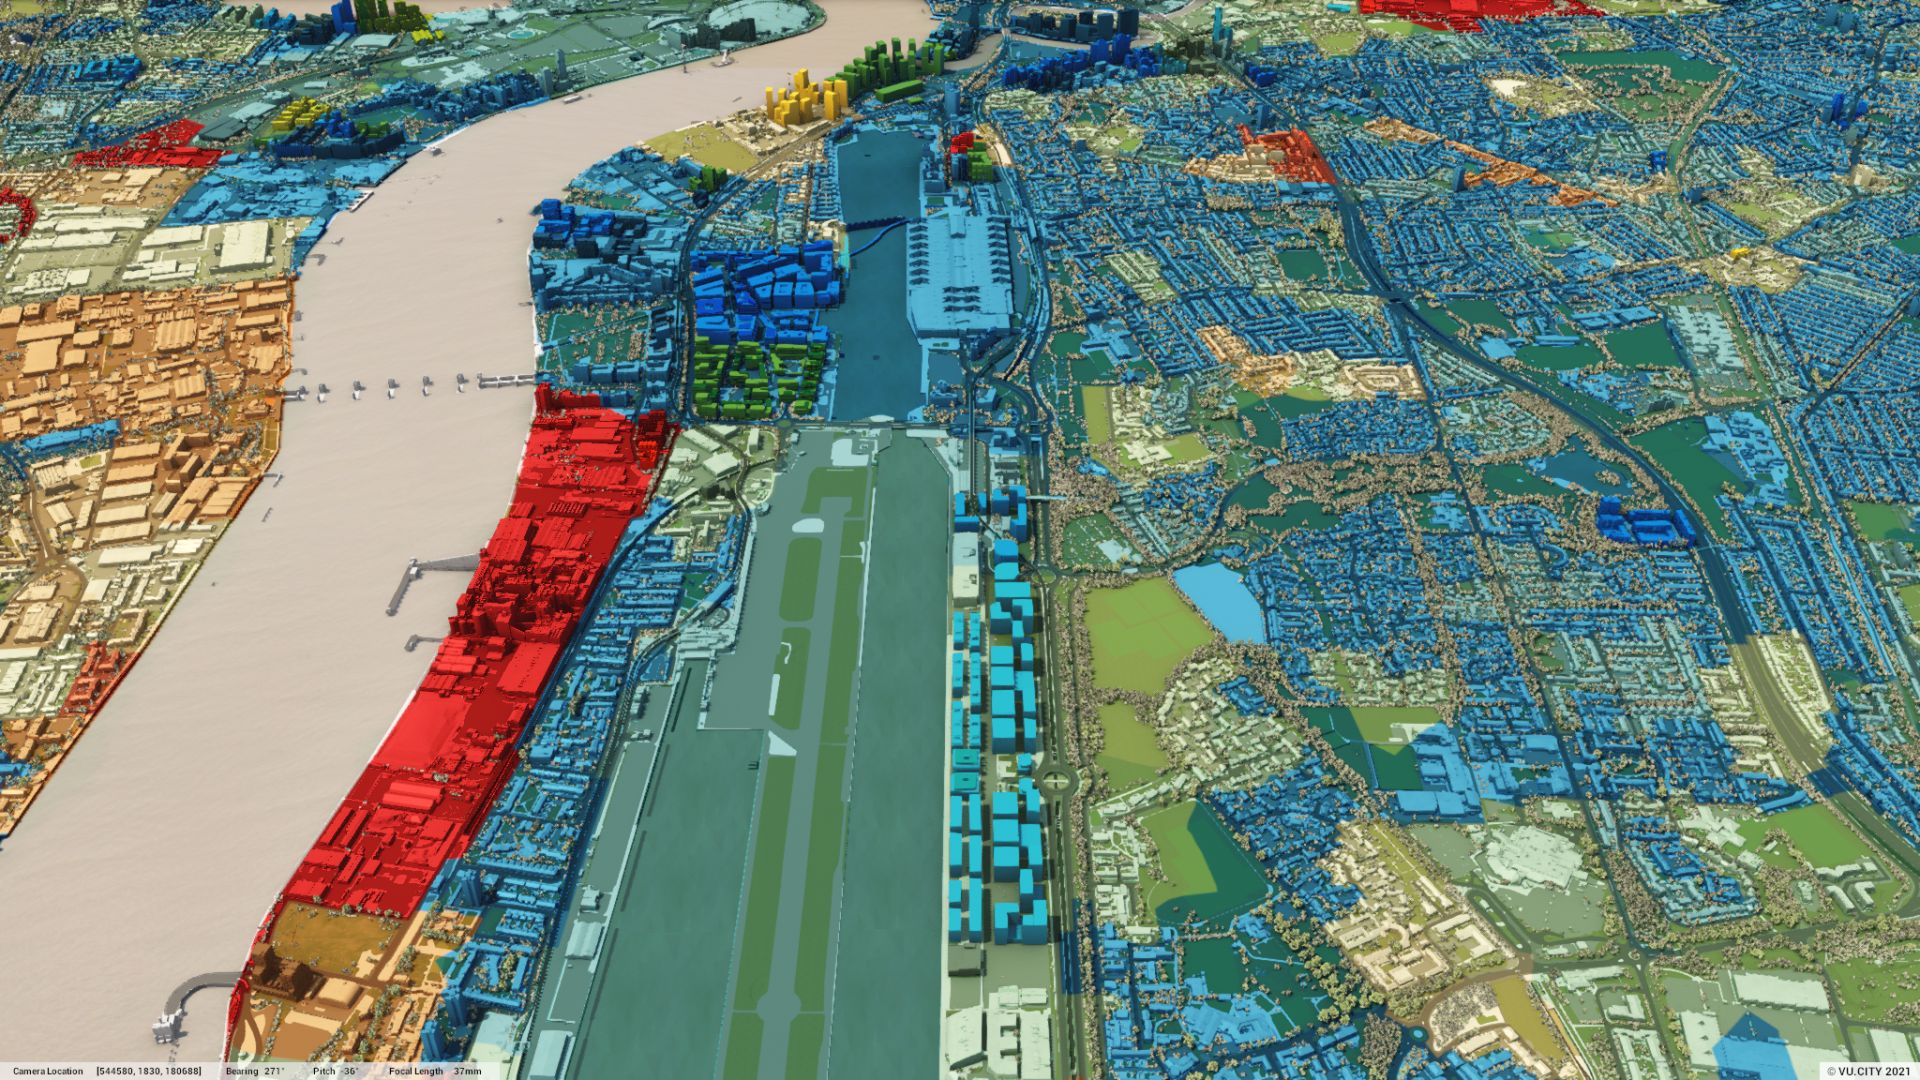
Explore property data to inform development potential.
Understand use class, property size, and ownership across surrounding buildings.
VU.CITY London Ofcom Internet Data Speed
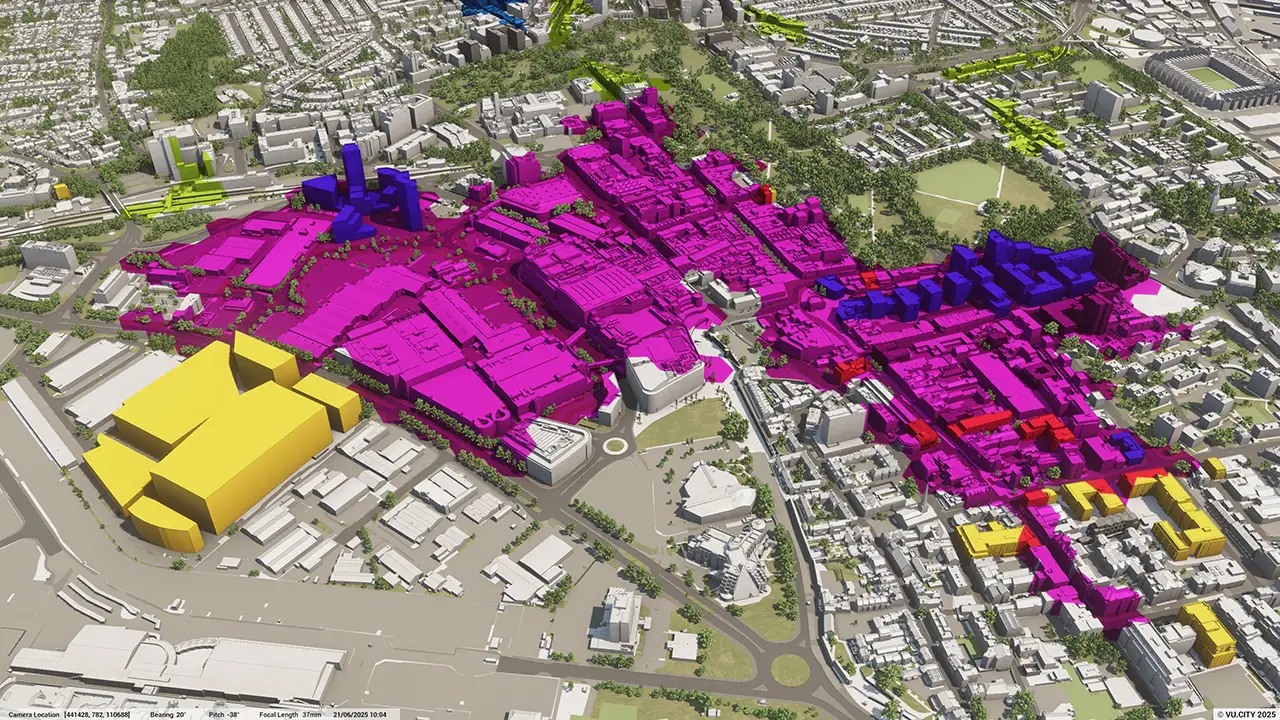
Assess retail footprint and potential.
Visualise retail units and catchments to inform commercial strategy and mixed-use design.
VU.CITY Southampton Retail Boundaries
Respect and protect nationally significant sites.
Flag scheduled monuments to ensure compliance with heritage and visibility constraints.
VU.CITY Edinburgh Scheduled Monuments
.webp)
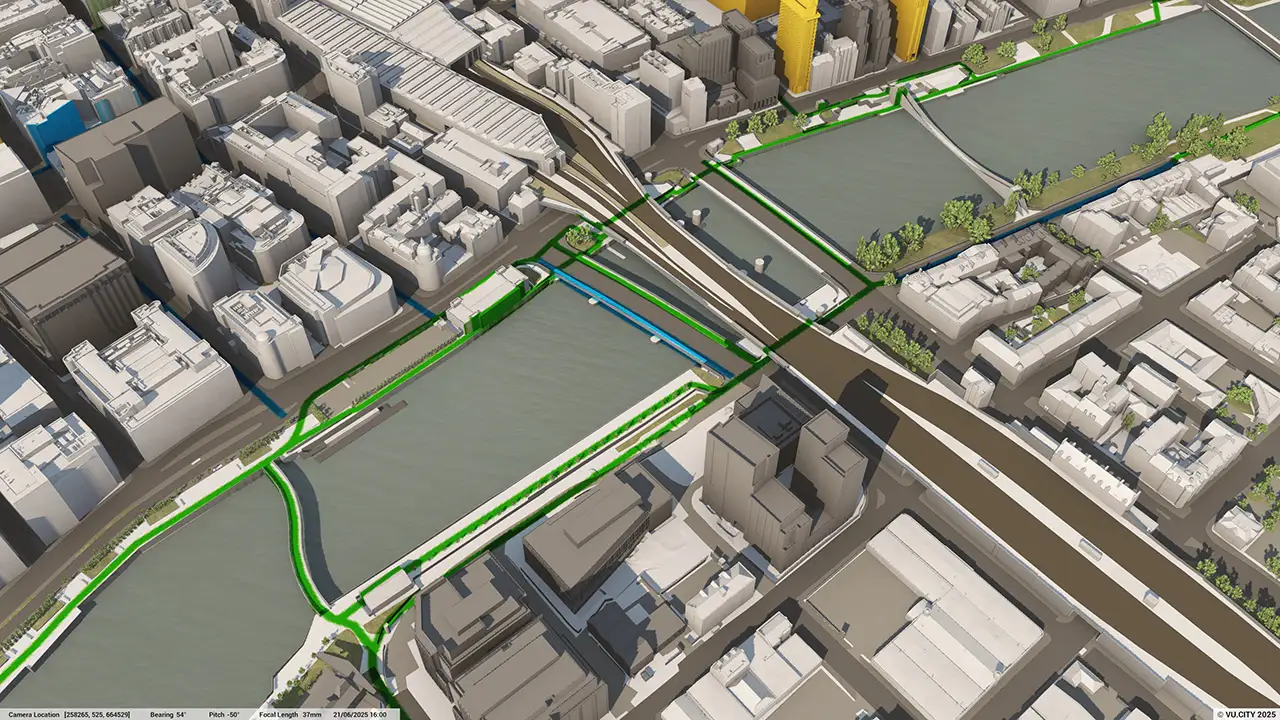
Map public transport access and movement patterns.
View stations, stops, routes and journey times to strengthen transport-led development.
VU.CITY Glasgow Cycle Routes
Import and visualise your own custom data.
Upload your own geospatial data relevant to your scheme.
VU.CITY Glasgow Your Point Data
VU.CITY Case Studies
See how leading built environment experts are using VU.CITY
-1-1-1.png)

VU.CITY seamlessly integrates with leading 3D digital software for an easy fit into existing workflows.
We are compatible with the biggest 3D software providers so that you can focus on your designs and plans with minimal disruption.
SiteSolve is our early-stage site exploration and generative design tool. Find out more.

Optimise FBX exports from Revit with our VU.CITY Revit Plugin and Update Agent. Embed materials, maintain positioning, and more.
Export SKP models to FBX using our VU.CITY SketchUp Plugin (beta). Produce FBX files optimised for use in VU.CITY.
Optimise and fix common issues with FBX models using our VU.CITY Blender Add-in. It's the best model editor we've come across.
Data Layer FAQ
Frequently Asked Questions about VU.CITY's Data Layers.
What are VU.CITY's 3D data visualisation tools?
VU.CITY’s 3D data visualisation tools integrate diverse data layers—from zoning and environmental metrics to infrastructure and socio-economic indicators—into interactive digital twins. This holistic approach enables professionals to visualise, analyse, and plan urban environments with unparalleled accuracy.
How do AI data visualisation tools enhance these capabilities?
Our AI data visualisation tools automatically analyse complex datasets and present them in clear, actionable formats. This technology identifies trends, simulates scenarios, and forecasts urban growth patterns, empowering architects, planners, developers, and local authorities to make data-driven decisions more effectivel
How can architects benefit from VU.CITY’s 3D data visualisation tools?
Architects can overlay critical information such as zoning regulations, environmental constraints, and material properties onto their designs. This integration supports the creation of innovative yet feasible architectural plans, ensuring that designs are both aesthetically compelling and technically precise
In what ways do urban planners use these tools?
Urban planners leverage these tools to consolidate multiple data layers into a unified, interactive model. By analysing demographic trends, infrastructure networks, and historical development patterns, planners can simulate various scenarios, optimise land use, and develop sustainable urban strategies.
How do property developers use VU.CITY’s 3D data visualisation features?
Developers utilise our tools to assess site potential, evaluate market dynamics, and navigate regulatory requirements. The ability to integrate AI-driven analytics further refines project feasibility studies, helping developers identify investment opportunities and streamline project approvals.
What advantages do local authorities gain from these visualisation tools?
Local authorities benefit from a comprehensive view of urban environments, where precise data on environmental metrics, infrastructure, and socio-economic factors come together. This clear, distortion-free visualisation aids in policy-making, regulatory compliance, and transparent communication with the community.
26 UK & International Cities
Over 3,000+ sq km accurate to 15cm | Tools to scope, create & collaborate on designs
Explore digital 3D geospatial solutions for the built environment
VU.CITY provides clear, powerful tools for key decision-makers across the built environment, helping them visualise and shape the future of cities with confidence and precision.
Make smarter decisions with data-driven insights, from infrastructure to sustainability.
Unlock the power of Generative AI for optimal design and streamlined decision-making.
Bring your designs to 3D life with state-of-the-art modelling tools.
Collaborate seamlessly across studies, planning, and design.
Utilise advanced 3D models and a data-driven approach with our flexible ZTV service.
Bring Your Vision to Life with a 3D Flythrough Video.
Shape Tomorrow’s Cities, Today.
Begin Your Free Trial Now.