

Network planning and expansion: 4D workflows for energy and utilities

From siting EV charging networks and planning data centres through to managing utility assets and transmission infrastructure,  we give your team the tools to  make faster, better-evidenced decisions.

Layer your data on an accurate 4D city map to future-proof your decision making. Ensure growth meets demand, avoid downtime and streamline expansion planning.

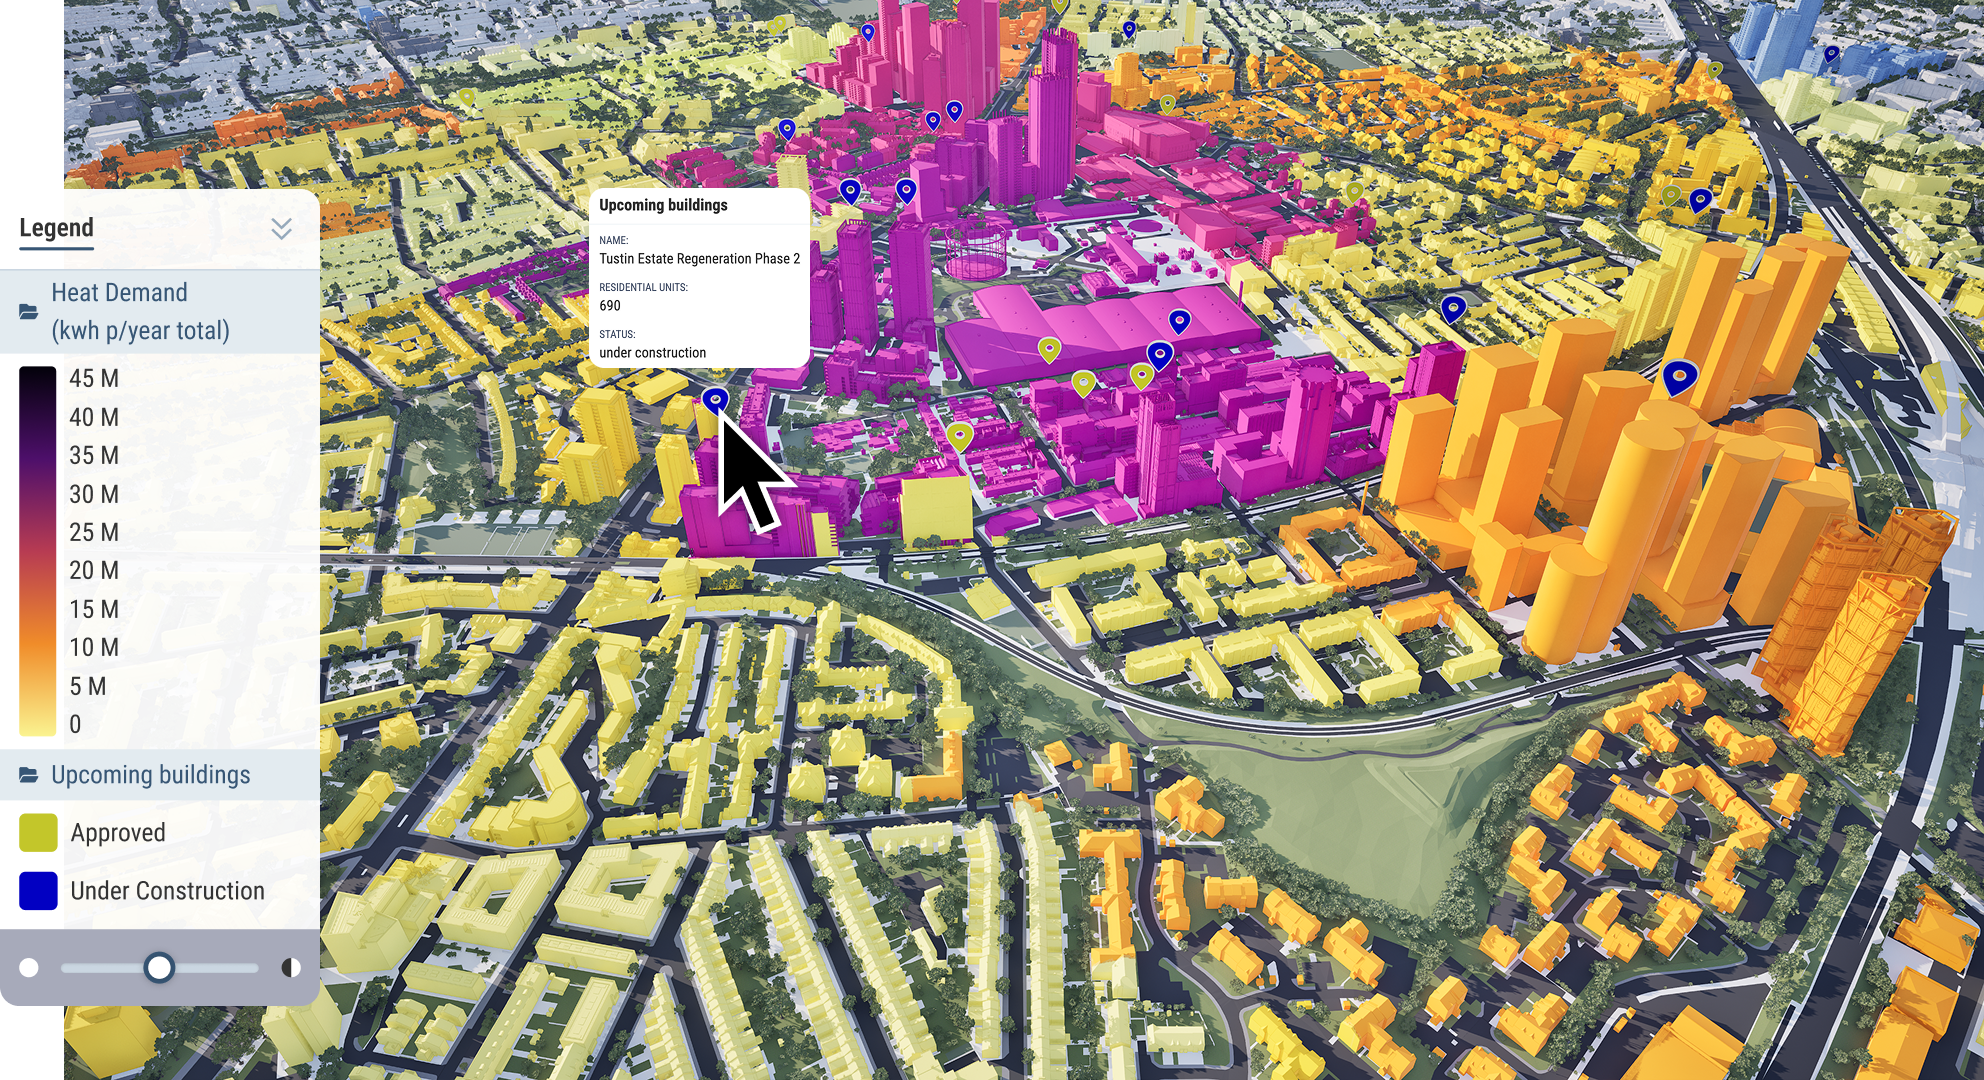
Visualise heat demand data with TfL network in 4D using VU.CITY

For energy, utilities and infrastructure teams

Our platform can be used by anyone - from total beginners to the absolute pro.

Sound familiar?

Your network data lives in GIS tools and spreadsheets. There is no single place where it meets the real city it sits in.
Urban growth reshapes demand every year. By the time it shows in your data, you are already behind.
Data centre planning applications need visual impact evidence that currently means briefing specialists separately.
Downtime and wasted capacity come from decisions made without a full spatial picture.
Your data and analysis is strong. Getting anyone outside the team to understand and act on it is the hard part.
A candidate site looks viable on paper but you do not know how the area will change over the next five years.

With VU.CITY

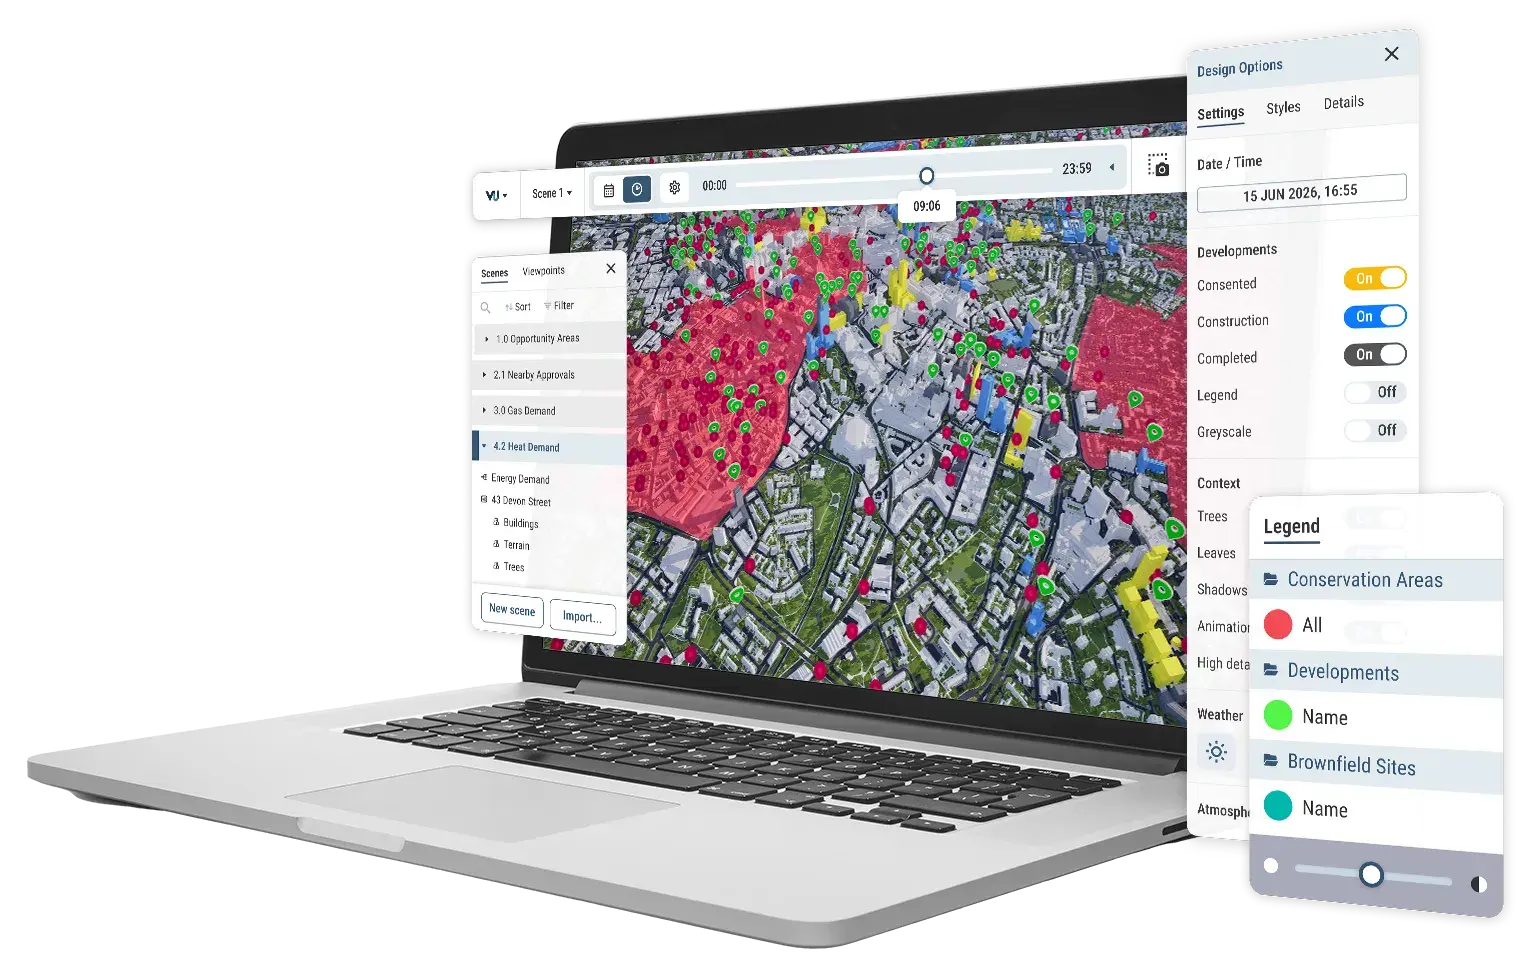
Bring asset data and demand forecasts onto a survey-accurate 4D city model.
Use the consented timeline to see where growth is heading before it hits your network.
Model any proposed structure in real city context and generate visual impact evidence directly.
Combine asset data with city-wide growth intelligence on one accurate city model.
Turn complex network data into clear visual presentations anyone can follow at a glance.
See consented and under-construction development around any site on a live 4D timeline.

Streamlined workflows with your AI assistant

Analyse data in seconds using VU.CITY Data Lab. Query substation proximity, consented development and land use data across candidate sites instantly, so site selection decisions are faster and better evidenced.

Our top tools for professionals


Consented timeline

See approved and under-construction development around any candidate site automatically added to the model.


Custom data layers

Bring in your own asset locations, demand forecasts, coverage maps or capacity data alongside our public data library.


Site context and distance measurement

View any candidate site in accurate 3D and measure distance, height and AOD within 15cm accuracy. Understand proximity to substations, residential areas and sensitive receptors using our mark-up and draw tools


Model import and visual impact

Import a model of any proposed asset, whether an EV charger, energy centre, substation or solar array, and place it accurately in the real surrounding city.


Quick Capture and imagery export

Capture and export high-quality stills and visuals directly from the platform for planning applications, investor presentations and local authority submissions.


4D change over time

See how areas around your infrastructure have changed and are set to change across the past, present and future.

How VU.CITY works for energy and utilities teams

From site selection to stakeholder sign-off

EV charging site planning

See candidate sites in real city context after demand modelling. Check substation proximity, land use and surrounding streets before committing.

Data centre planning

Import a model of any proposed data centre and place it in the real surrounding city. Generate visual impact evidence directly.

Network expansion

See where urban growth is heading before it hits your network. Plan expansion ahead of demand using the consented timeline.

Utility asset management

Bring asset locations, demand forecasts and capacity data onto a survey-accurate 4D city model alongside our public data library.

Stakeholder engagement

Present rollout strategies and site decisions in immersive visual presentations that planning authorities and investment committees can follow at a glance.

Energy and utilities FAQ

Frequently asked questions from energy and utilities  professionals using VU.CITY

How do I assess candidate EV charging sites in their real surrounding context after demand modelling?

Once you have identified candidate locations through demand forecasting, VU.CITY lets you view each one on a survey-accurate 3D city model, including substation proximity, surrounding streets and buildings, existing competitor chargers and land use, so you can sense-check viability in the real environment before committing to a site.

What evidence do I need for a data centre planning application in the UK?

Since data centres were designated as Critical National Infrastructure in 2024, planning applications increasingly require visual impact evidence, acoustic impact assessment and demonstration of how a proposed structure sits within its surrounding area. VU.CITY lets you model any proposed structure in real city context and generate that evidence directly, without briefing a separate specialist team.

How do I show consented and planned development near a data centre site to support a planning narrative?

VU.CITY automatically tracks publicly available planning data and adds approved and under-construction developments to the model, so you can show how the surrounding area is changing alongside your site, which supports Gate 2 planning readiness and helps anticipate future demand and access context.

What GIS tools can energy and utilities teams use to visualise assets and infrastructure in 3D?

VU.CITY sits alongside specialist GIS and demand tools as the spatial context layer, letting you bring your own asset locations, demand data and capacity information into a survey-accurate 3D city model. Rather than replacing your existing data tools, it gives your data a real physical environment to live in.

How do I present an EV charging rollout plan to a local authority?

You can build immersive, visual presentations in VU.CITY that show site locations, surrounding context and phasing in a format that non-technical stakeholders can follow at a glance, which is particularly useful for planning committee submissions and public consultations where data tables and spreadsheets do not land clearly.

How do I show how an area around a candidate site will change over the next five years?

VU.CITY's consented timeline automatically surfaces approved and under-construction developments around any location, so you can show a planning authority, investor or local council how an area is set to change, not just how it looks today.