

VU.CITY-icon-London-light
4D-icon-alt-white

London 3D Model

Work with confidence using our government-trusted London city model.

Ideate, plan, analyse and present your work on a visually stunning, survey-accurate 3D city model of London, including all future approved and under-construction buildings.

Our model is trusted by 85% of all London boroughs and the Greater London Authority.

  • data-icon-white-2
    290
    DATA LAYERS
  • 1730.56 sq km
    MODELLED TO 15CM ACCURACY
  • 102
    HIGH DETAIL BUILDINGS
  • 3,652
    Consents approved
  • 10,390,300
    TREES, ACCURATE HEIGHT AND CANOPY

See the past, present & future in VU.CITY

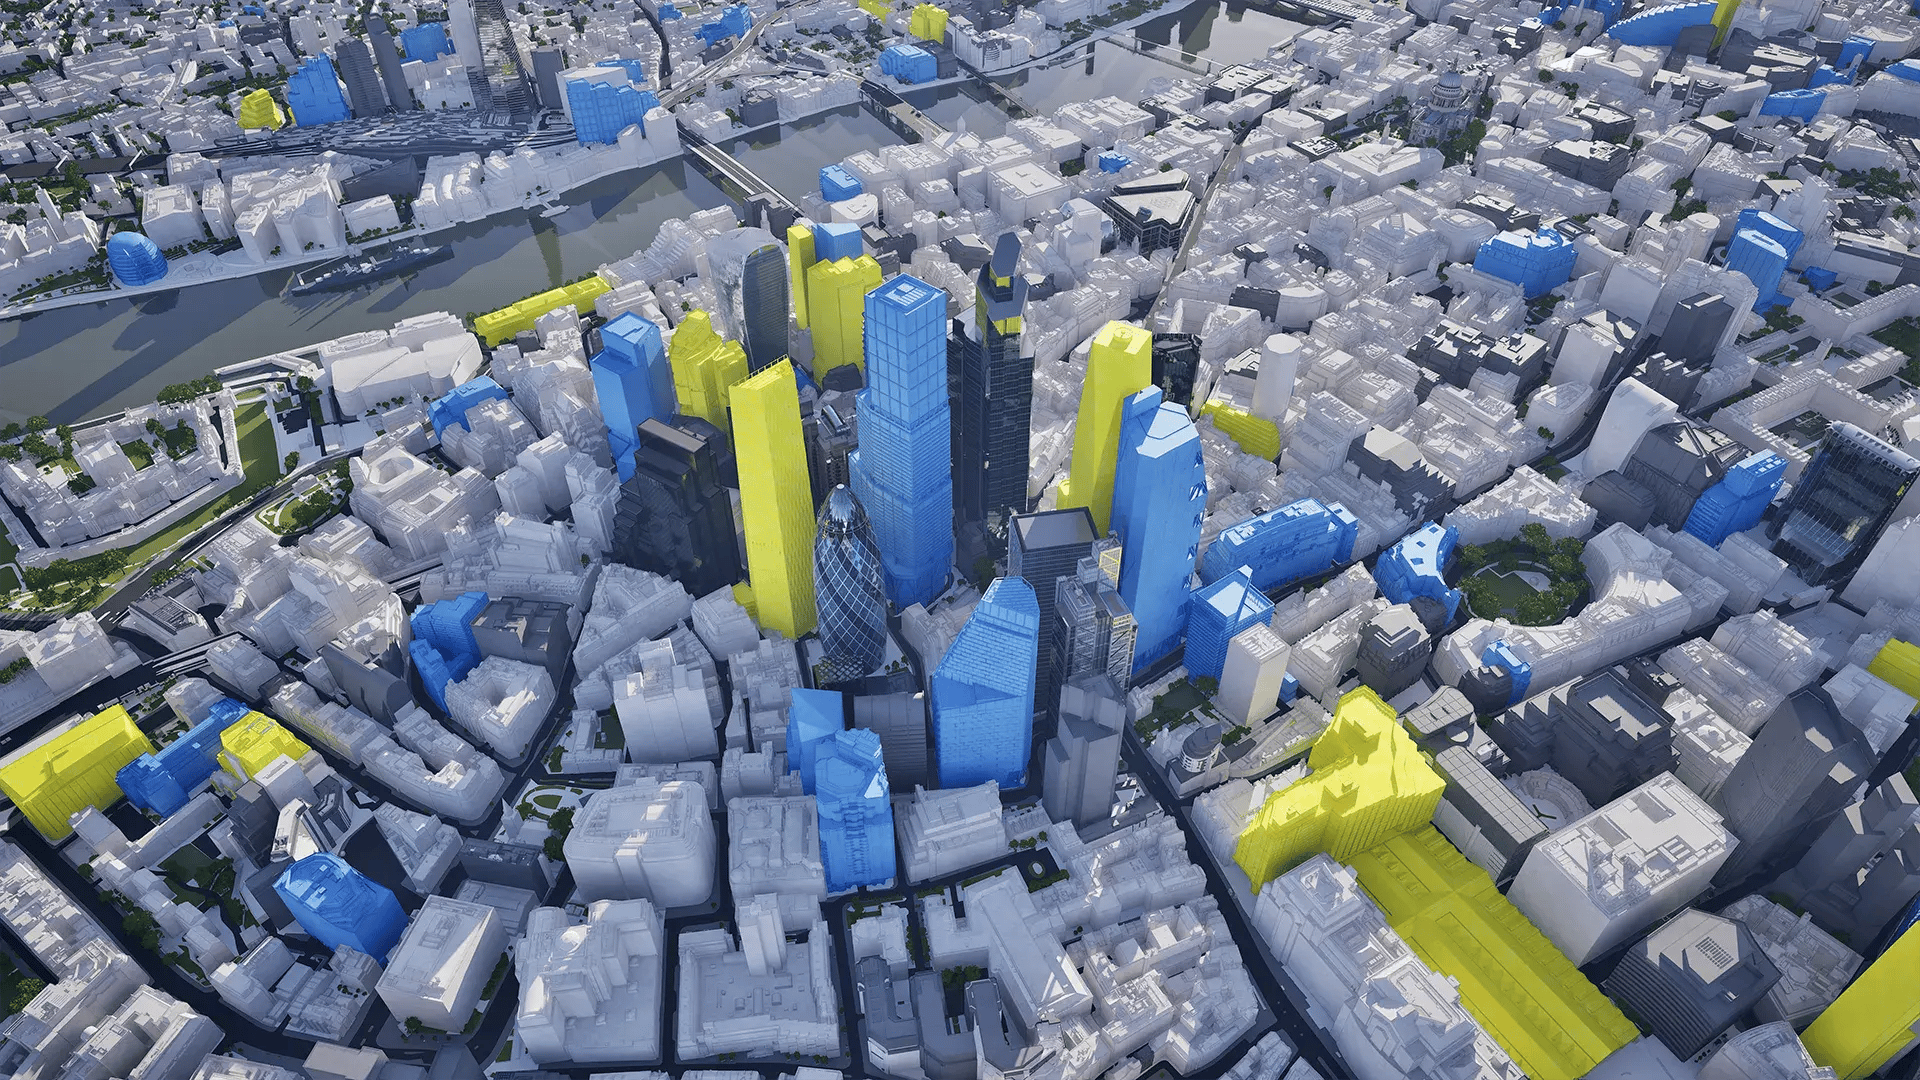
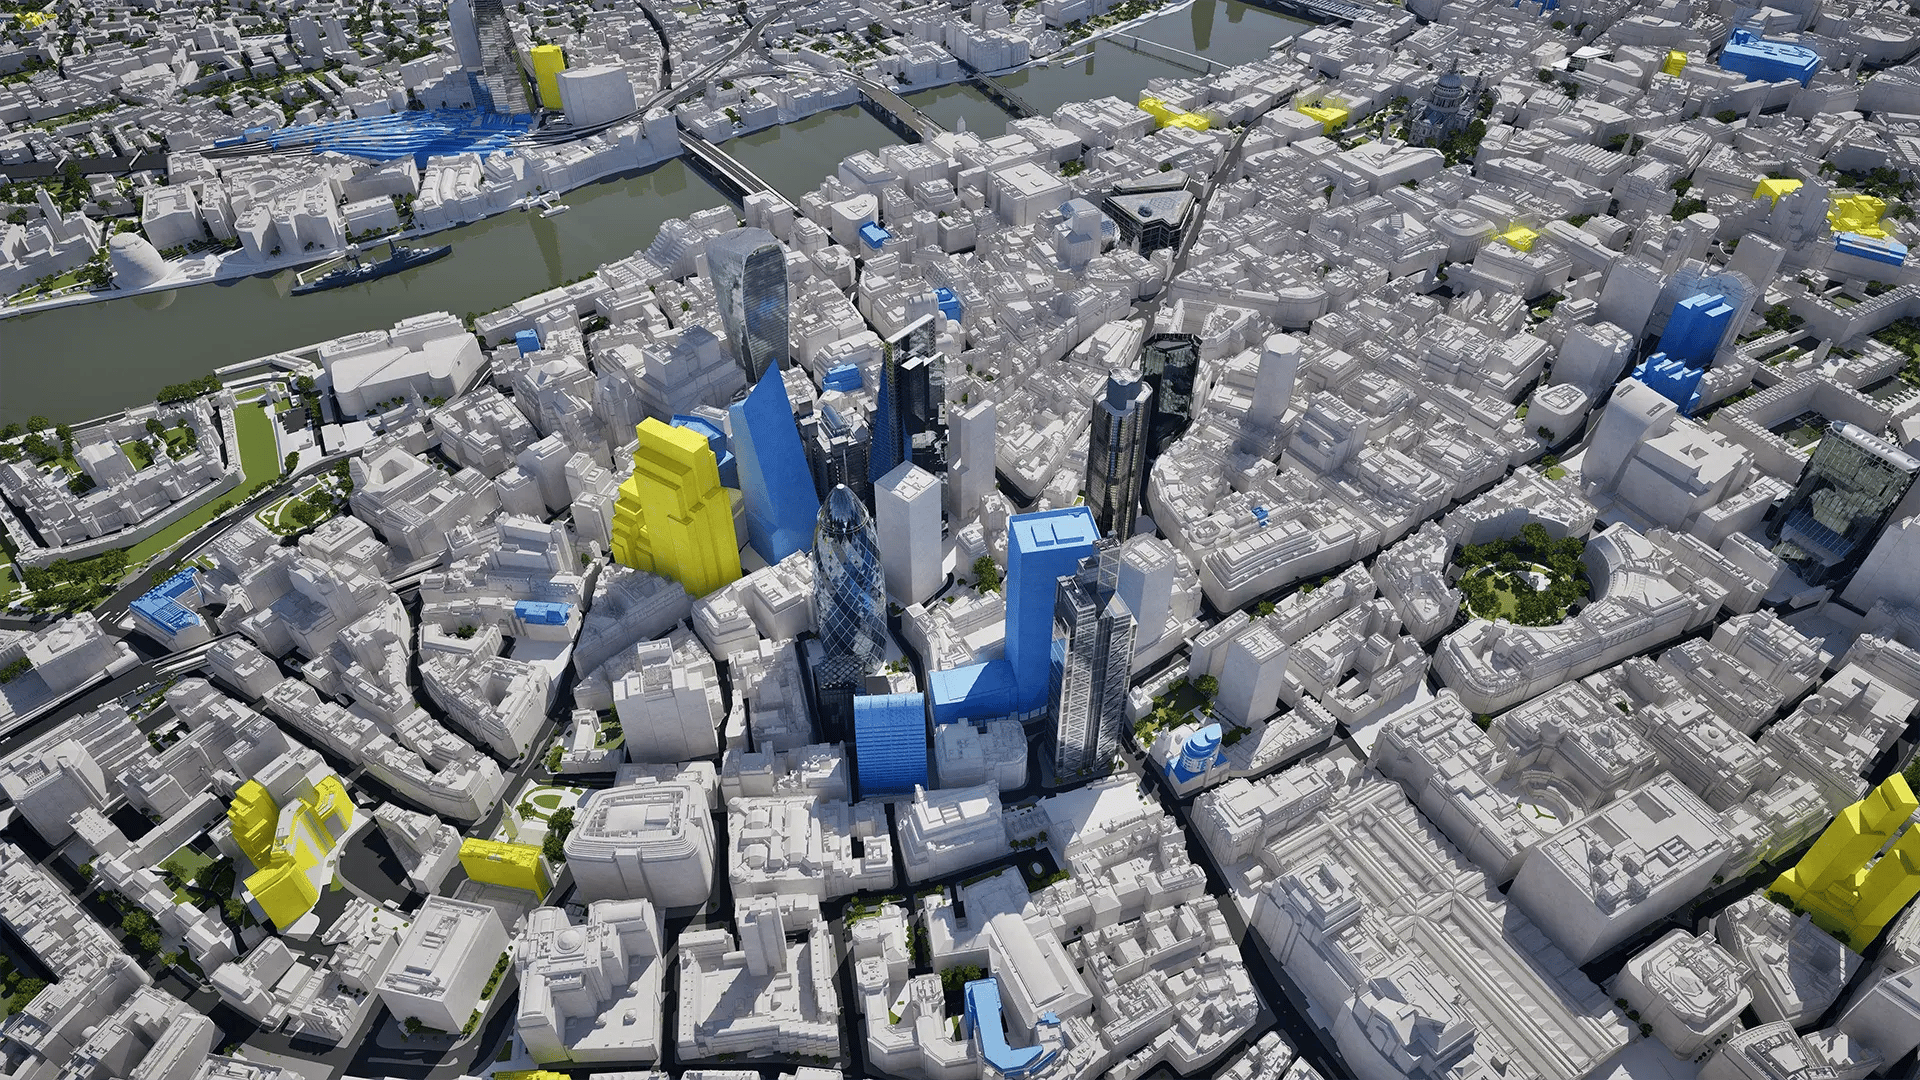
VU.CITY London city cluster skyline in 2027 London in 2016 London in 2027
Models. Data. Tools. All in one platform.
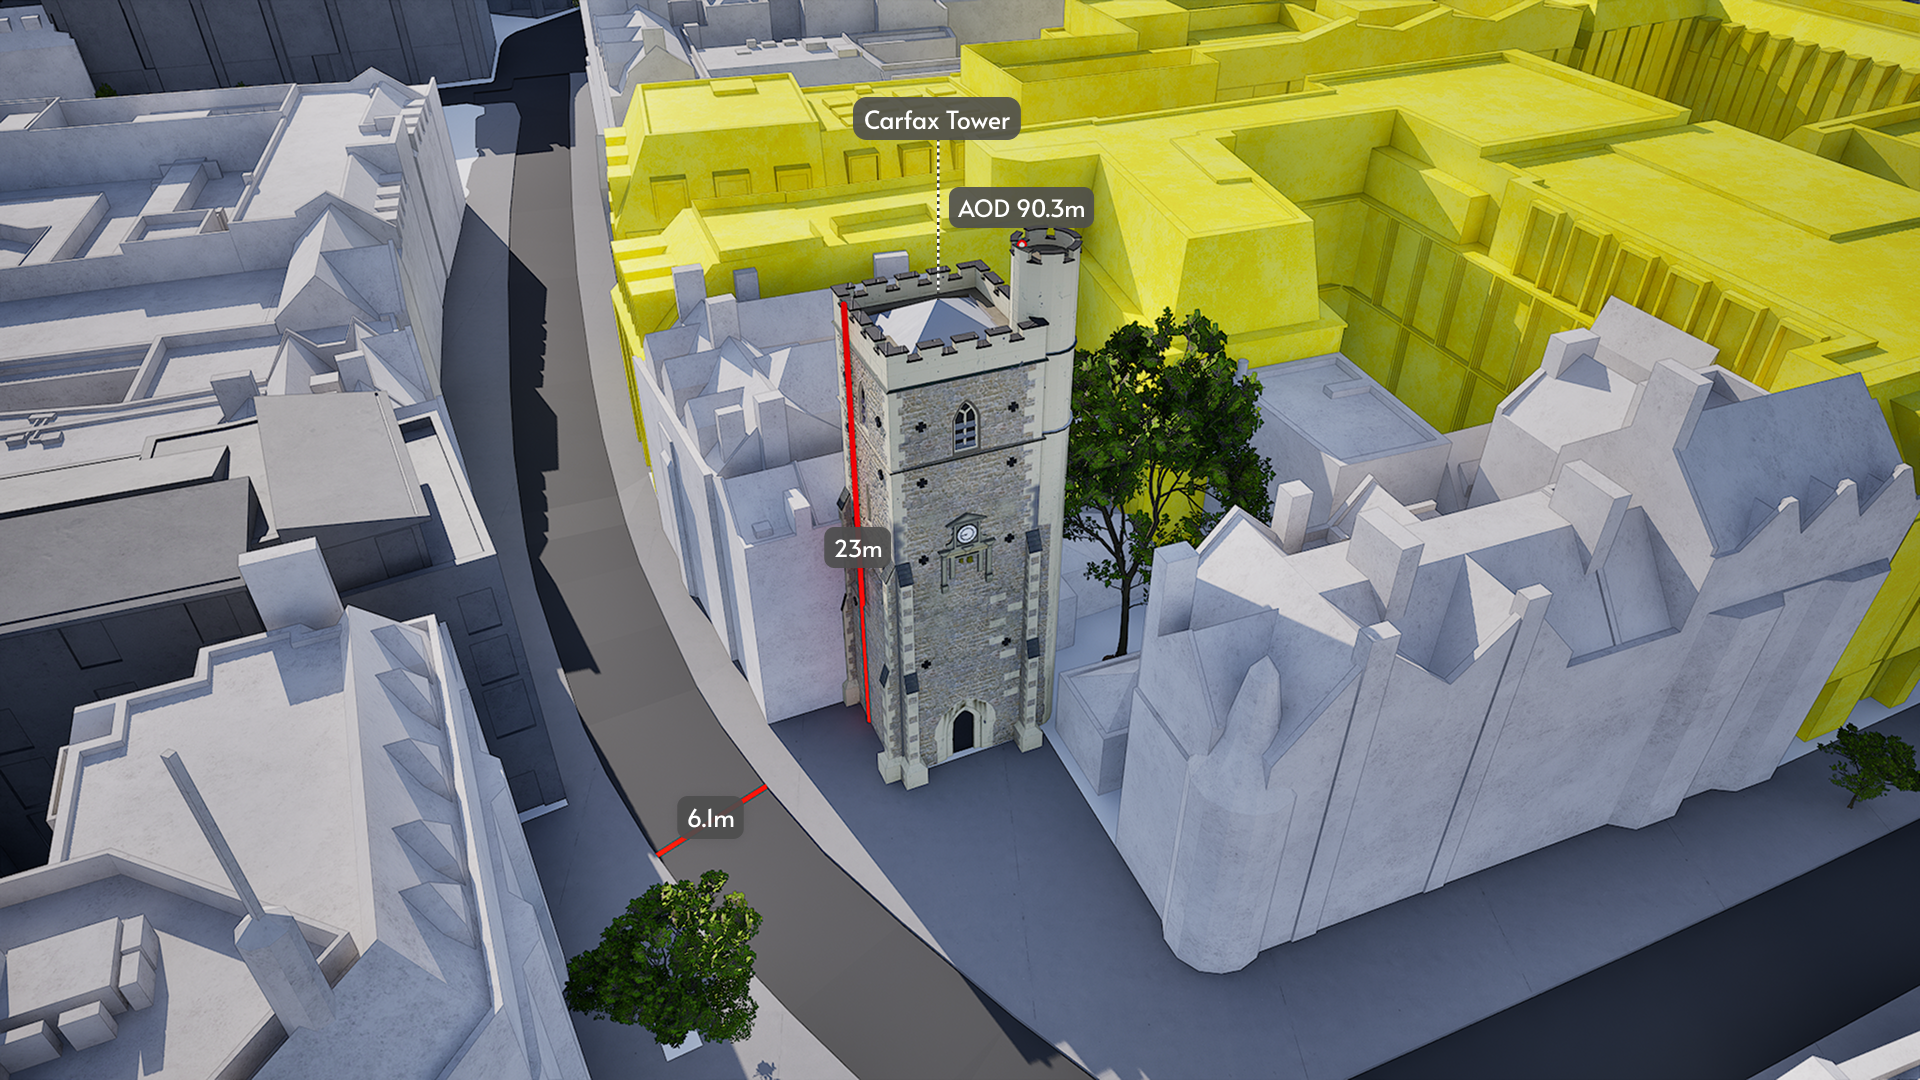
Oxford Carfax Accuracy

We provide the most accurate and detailed managed city models available. ±15cm for all buildings, trees and terrain.

Developments + data

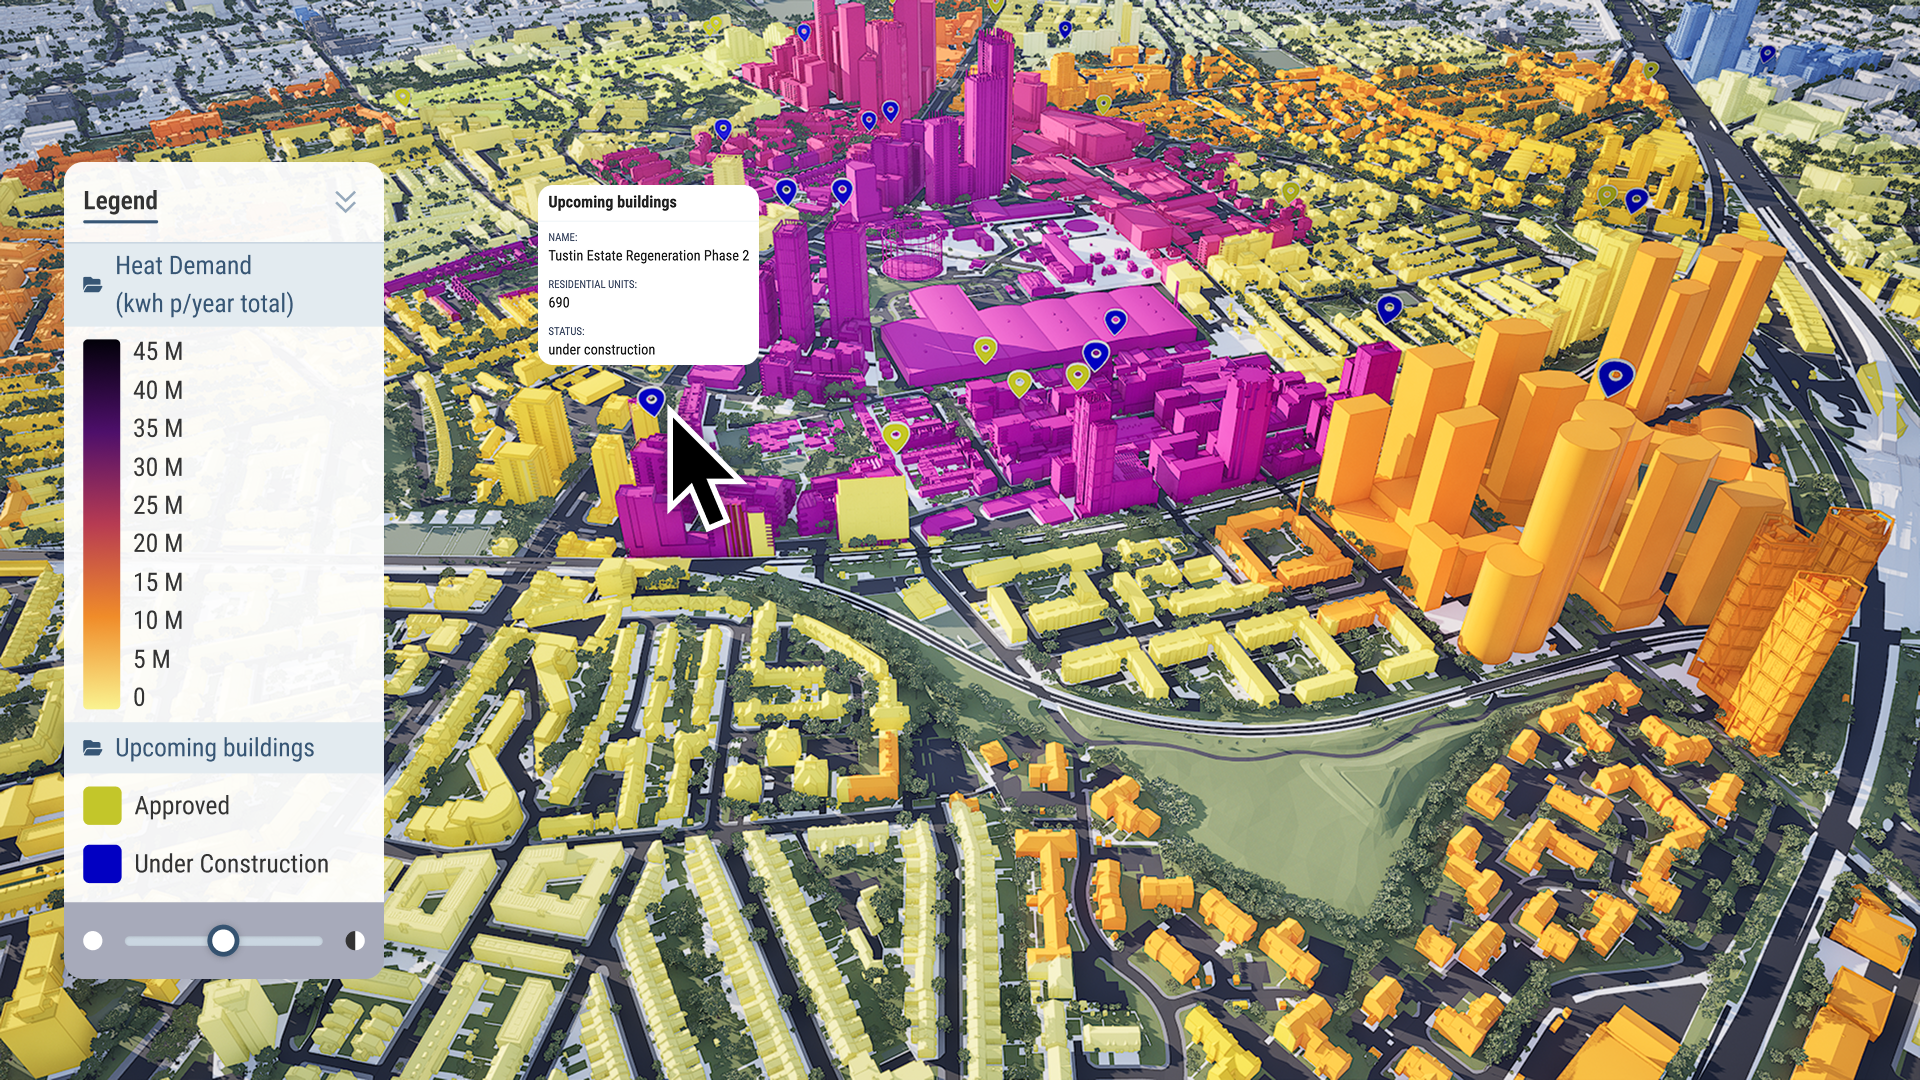
Our public data is available to all users. You can also import your own, private data for your projects. Visualise, analyse and filter large-scale data sets with ease.

3D draw

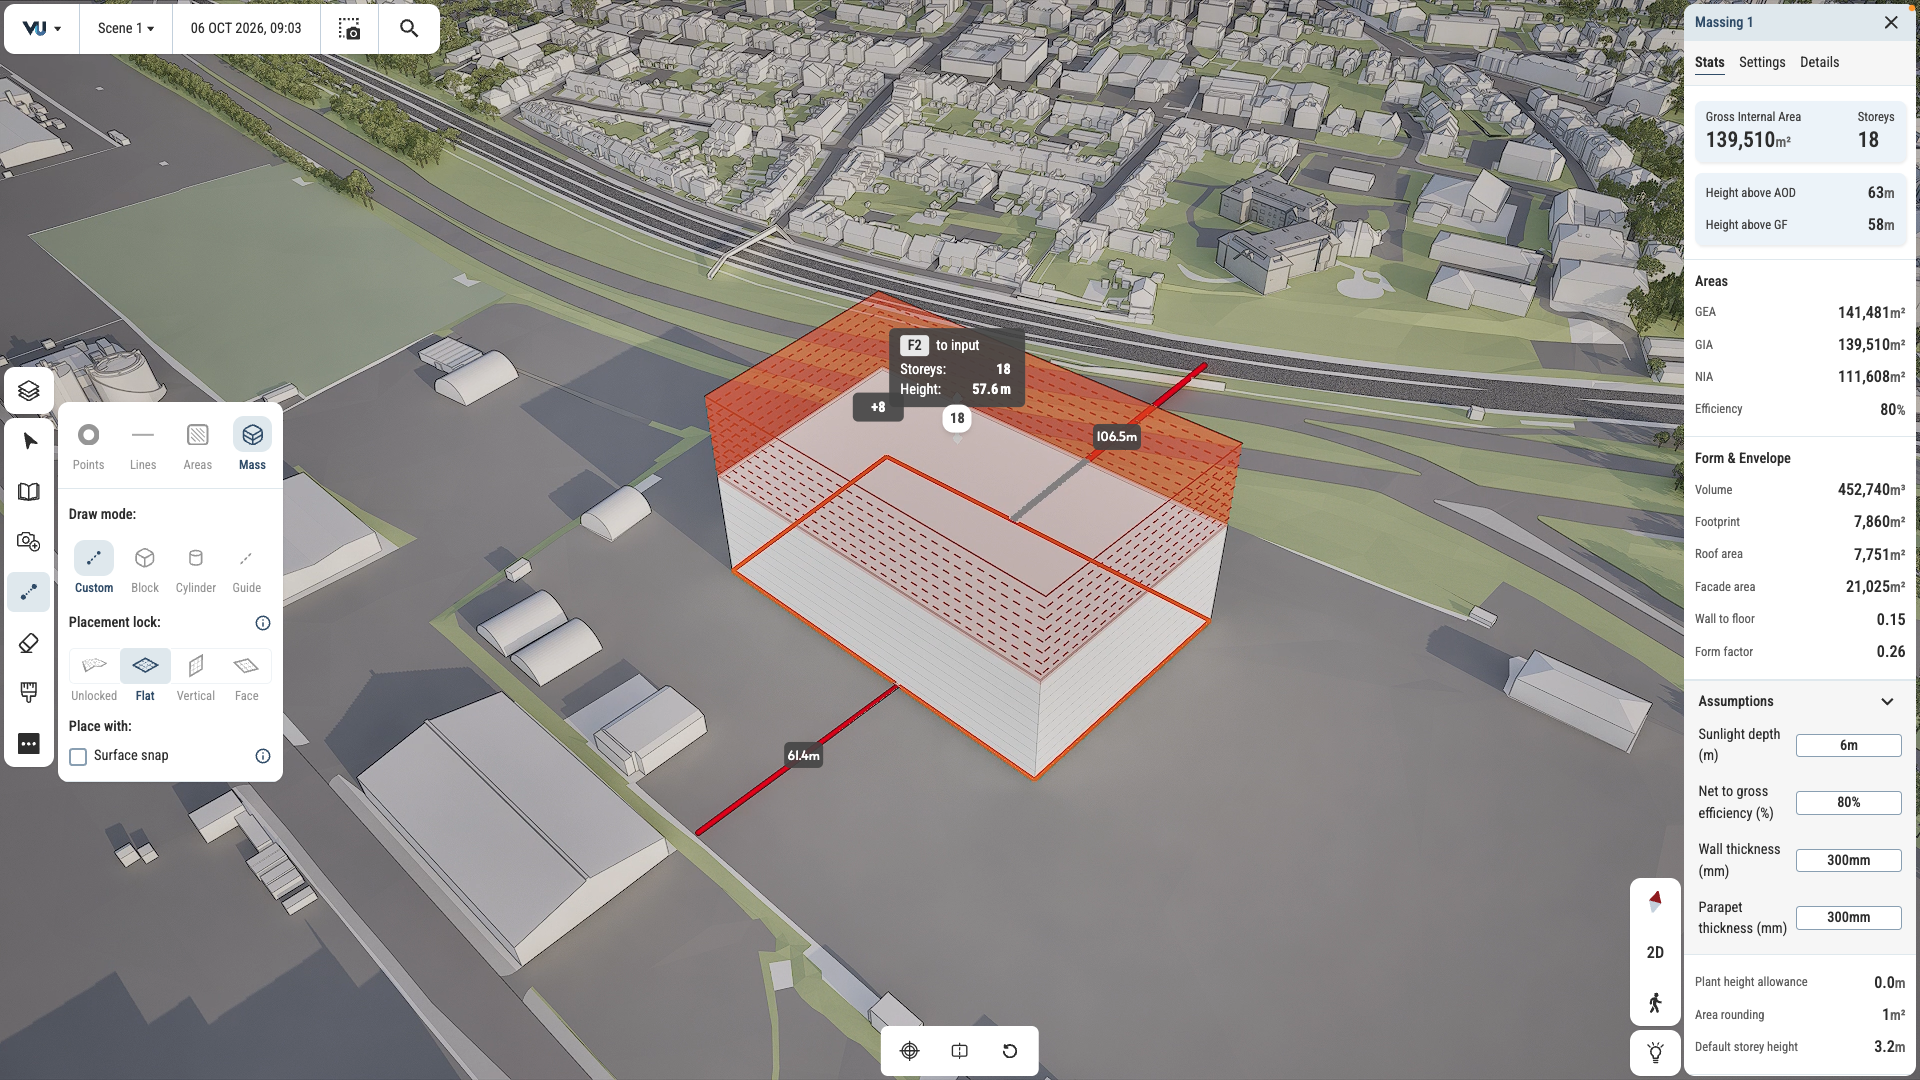
Test and iterate ideas in survey-accurate context. Draw in 2D and 3D. Mark up plans and create maps with stakeholder-ready visual quality.

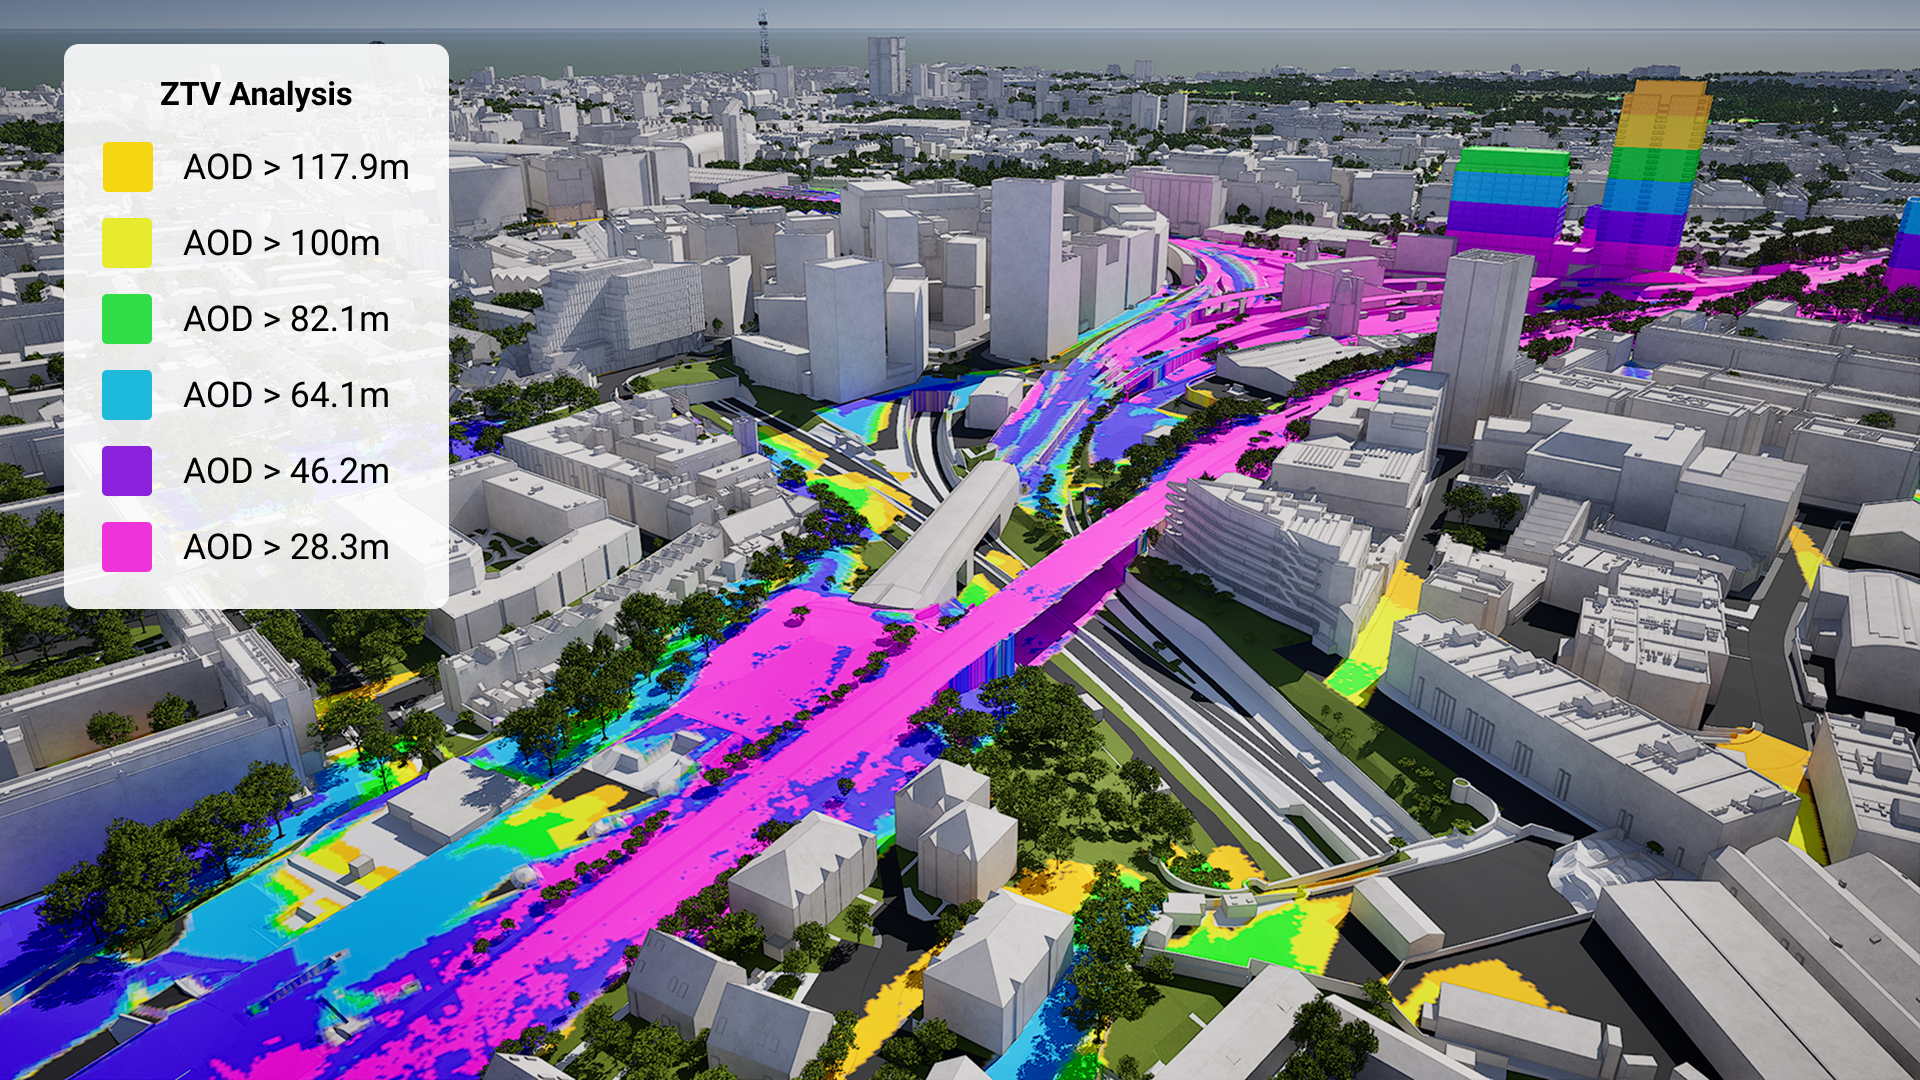
VU.CITY ZTV Analysis-1

Generate ZTV studies and viewsheds in just a few clicks. See sunlight paths and overshadowing instantly.

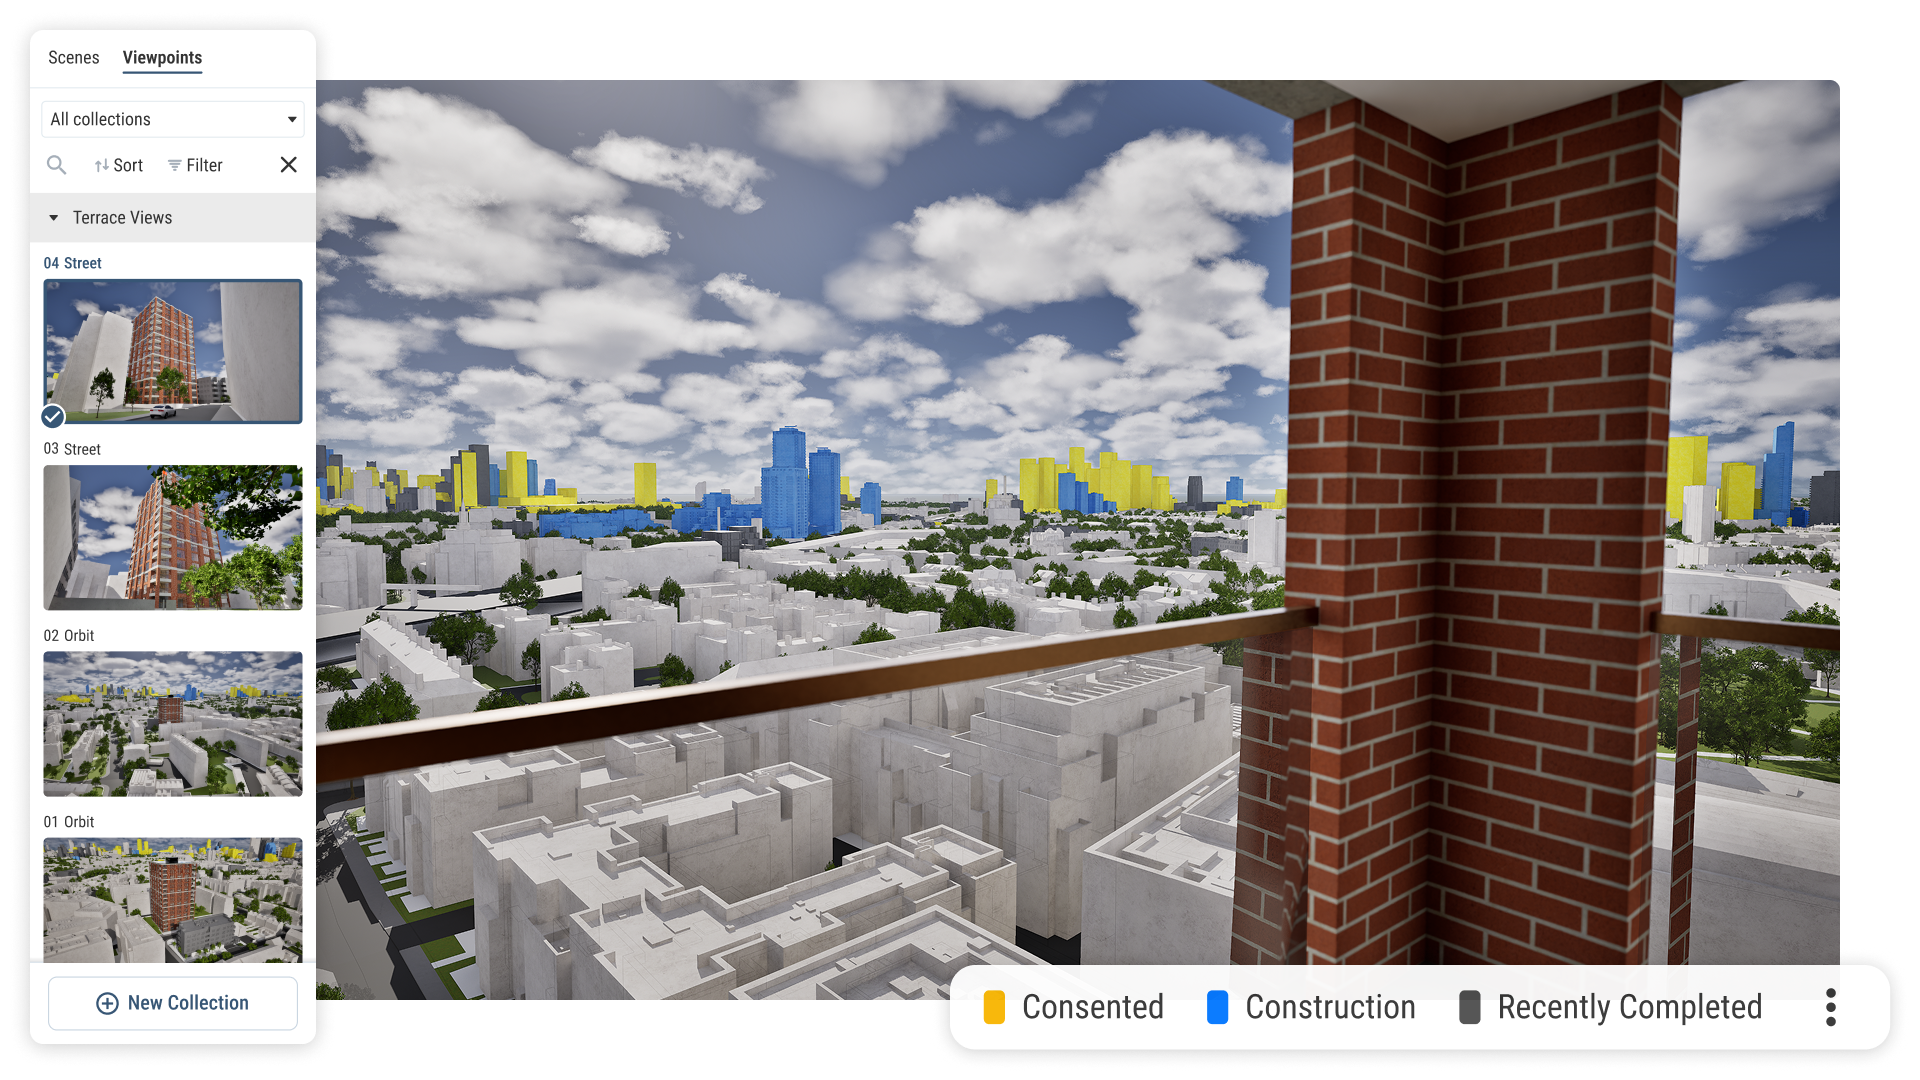
Visualise Real Estate assets and their views out in 4D

Create guided tours and presentations, export high quality imagery and share files with stakeholders for seamless collaboration and feedback.

GeometrySurvey-grade 3D city models
DataA public data library
Design toolsDraw, measure, annotate
Analysis toolsVisibility, sunlight and more
Presentation toolsTell your story, your way

Government-trusted London coverage

Our coverage contains the most detailed and accurate managed models available, with continually expanding coverage.

data-icon-white-2

London data layers for contextual viability

Across transportation, demographics to environmental factors, the data layers in VU.CITY’s London 3D model provide essential insights for more informed and confident decision-making.

Administrative Boundaries

  • Boroughs

  • Central Activity Zone

  • Town Centres

  • Westminster Central Activities Zone

  • Westminster Local Centres

Amenities & Services

  • Educational Establishments

  • GP Practices

  • Hospitals

  • Locally Important Buildings

  • Principal Shopping Areas

  • Retail Boundaries

Crime & Safety

  • Burglary

  • Robbery

  • Shoplifting

  • Theft

Demographics & Economy

  • Deprivation Index

  • House Prices

  • Population Density

Energy & Utilities

  • Broadband Speed

Green Spaces & Open Areas

  • Protected Squares

  • Designated Open Space

Heritage & Conservation

  • Conservation Areas

  • Greater Archaeological Priority Areas

  • Listed Buildings

  • Scheduled Monuments

Planning & Development

  • Areas of Intensification

  • Brownfield Register

  • Camden Planning Applications

  • Locally Significant Industrial Sites

  • Site Allocations

  • Strategic Industrial Land

  • Developments

  • Opportunity Areas

  • St Paul's Depth

Protected Viewing Corridors

  • Monument Views and Settings

  • Tower of London WHS Local Setting Area

  • Protected Vistas Extension

  • Southwark Borough Viewpoint Locations

  • Southwark London View Management Framework Landmark Viewing Corridors

  • Southwark London View Management

Transport & Accessibility

  • Sustrans Cycle Network

  • TfL Cycle Routes

Hover over each card to see more

Explore VU.CITY's tools

VU.CITY-icon-London-light

VU.CITY London is the largest and most accurate interactive 3D model and digital twin available.

The Greater London Authority's (GLA) London Plan sets the city’s planning framework with policies relating to the massing, density and height of new developments. These apply across every borough and a 3D digital platform, such as VU.CITY, can demonstrate the much-needed context and impact of every new project in a visual and easily digestible way.

VU.CITY London is the largest and most accurate interactive model of the capital—built to support better, faster, and more cost-effective decisions across the built environment. Covering all 1,730.56 sq km of London to 15cm accuracy, it combines powerful functionality with rich data to help you explore, assess, and deliver projects with confidence.

Over 85% of London boroughs already use VU.CITY: improving pre-app through open, transparent conversations about density and height; giving planning submissions and committees better insight on how a scheme will work in context; and allaying anxieties by helping citizens understand a scheme’s impact and merits in public consultations.

Architects such as Foster + Partners, BDP, Allford Hall Monaghan Morris, Bennetts Associates and Farrells have also seen the many benefits of using VU.CITY on projects. VU.CITY London has helped them improve communications with clients, win contracts, and create an inclusive narrative with all stakeholders – local authorities, project teams, politicians and communities – on how schemes will work and succeed.

VU.CITY London FAQs

Here are some frequently asked questions about VU.CITY's London 3D Digital Twin and Model.

How does VU.CITY London support urban planning and development projects?

VU.CITY London leverages digital twins and advanced planning software tools to provide a detailed, interactive 3D model of the city. It enables planners, developers, and architects to visualise projects within the context of London’s existing infrastructure. By incorporating city data aggregation, the platform helps users assess contextual viability, streamline specialist analysis workflows, and enhance decision-making for project approval processes.

What data layers are available in the VU.CITY London model?

The VU.CITY London model includes diverse data layers such as transport networks, environmental impact zones, historical landmarks, building heights, and more. These layers, enriched by city data aggregation, provide critical insights to support enhanced decision-making, contextual viability assessments, and visual storytelling for project presentations.

Can VU.CITY London be used for feasibility studies?

Yes, VU.CITY London is a powerful tool for feasibility studies. It enables users to evaluate development potential, assess planning requirements, and identify challenges early in the process. This streamlines specialist analysis workflows and ensures better project compliance and enhanced decision-making throughout.

Who can benefit from using VU.CITY London?

VU.CITY London benefits urban planners, architects, developers, local authorities, and asset managers by offering interoperability with other planning software tools. Its comprehensive features support city data aggregation, contextual viability assessments, and visual storytelling, empowering stakeholders to visualise, plan, and manage projects effectively within London’s regulatory and environmental context.

How frequently is the VU.CITY London model updated?

The VU.CITY London model is regularly updated to reflect the latest changes in the city’s landscape, planning regulations, and available data. This ensures users always have access to accurate, real-time information for streamlined workflows, enhanced decision-making, and effective project planning.

Explore digital 3D geospatial solutions for the built environment

VU.CITY provides clear, powerful tools for key decision-makers across the built environment, helping them visualise and shape the future of cities with confidence and precision.

Make smarter decisions with data-driven insights, from infrastructure to sustainability.

Unlock the power of Generative AI for optimal design and streamlined decision-making.

Bring your designs to 3D life with state-of-the-art modelling tools.

Licence any VU.CITY city and design, test and present your project in its real context.

Utilise advanced 3D models and a data-driven approach with our flexible ZTV service.

Showcase your proposal in its real-world context with compelling, easy-to-understand flythroughs.
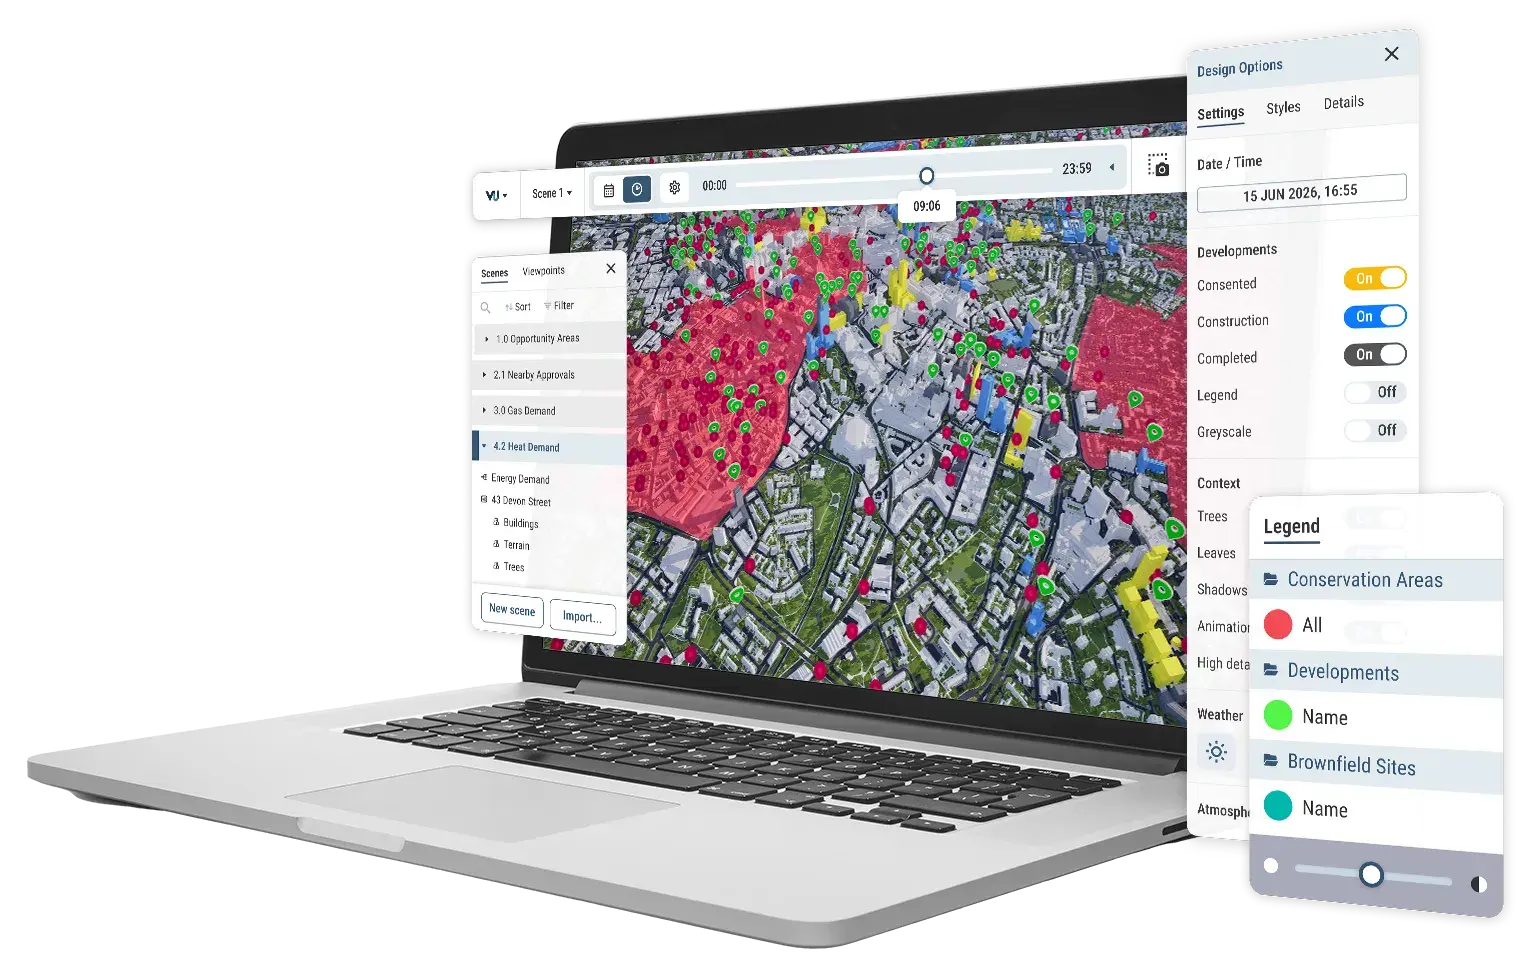
VU.CITY on a laptop showing scene manager, consented timeline, point and area data