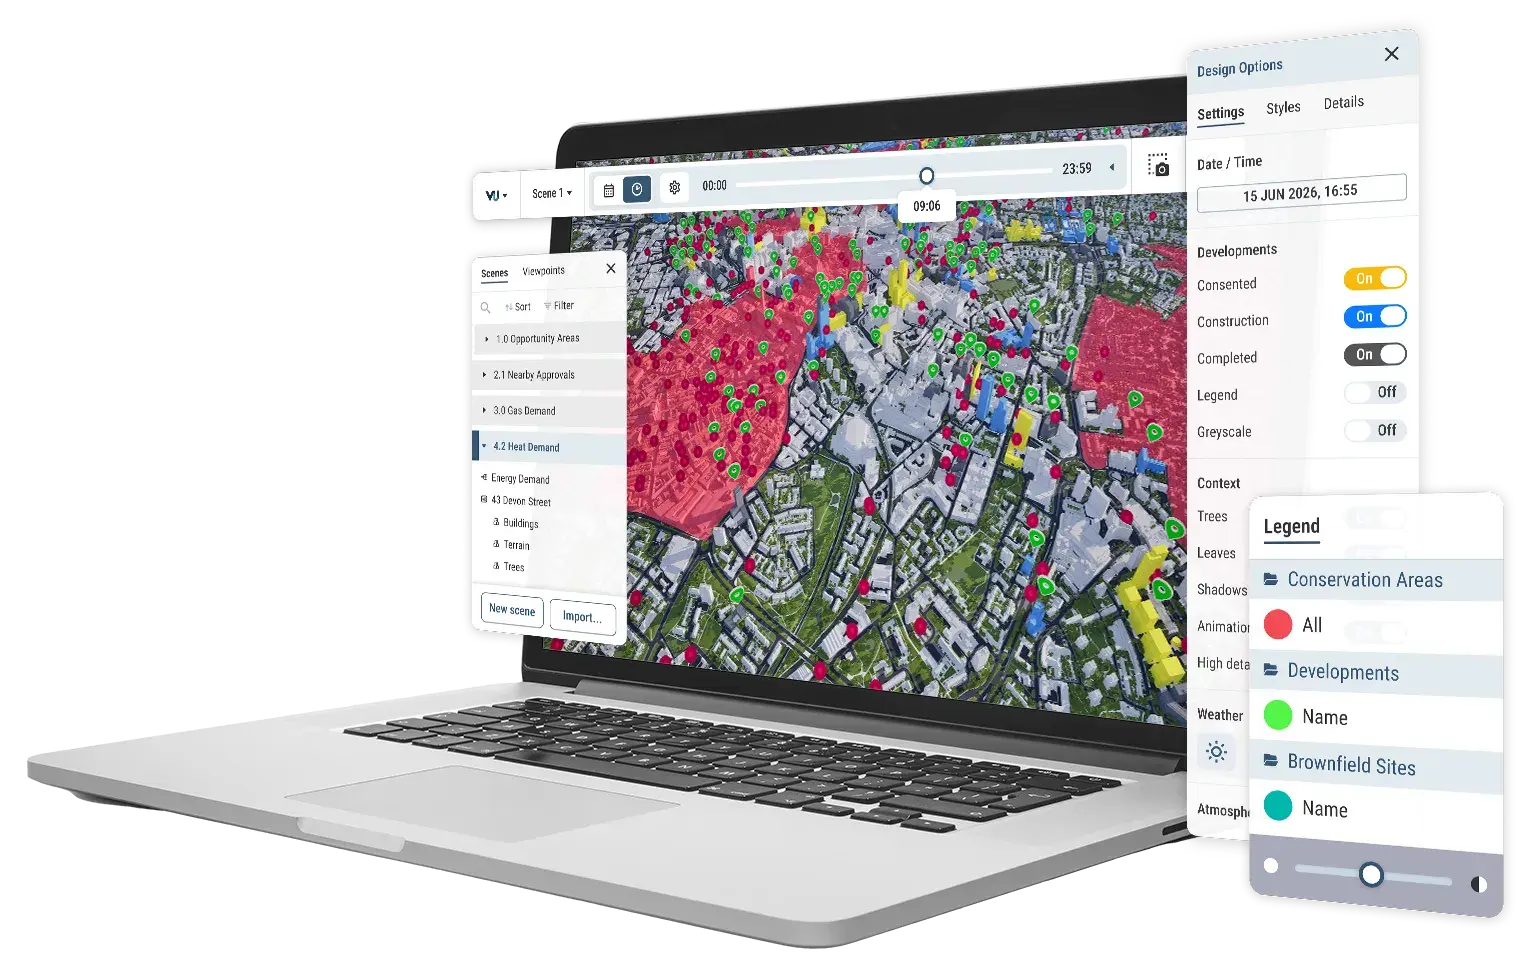


Understand context, risk and opportunity.

Combine your private data and intelligence with our survey-accurate 3D city maps and public data library. Discover and present insights in a way anyone can understand.     

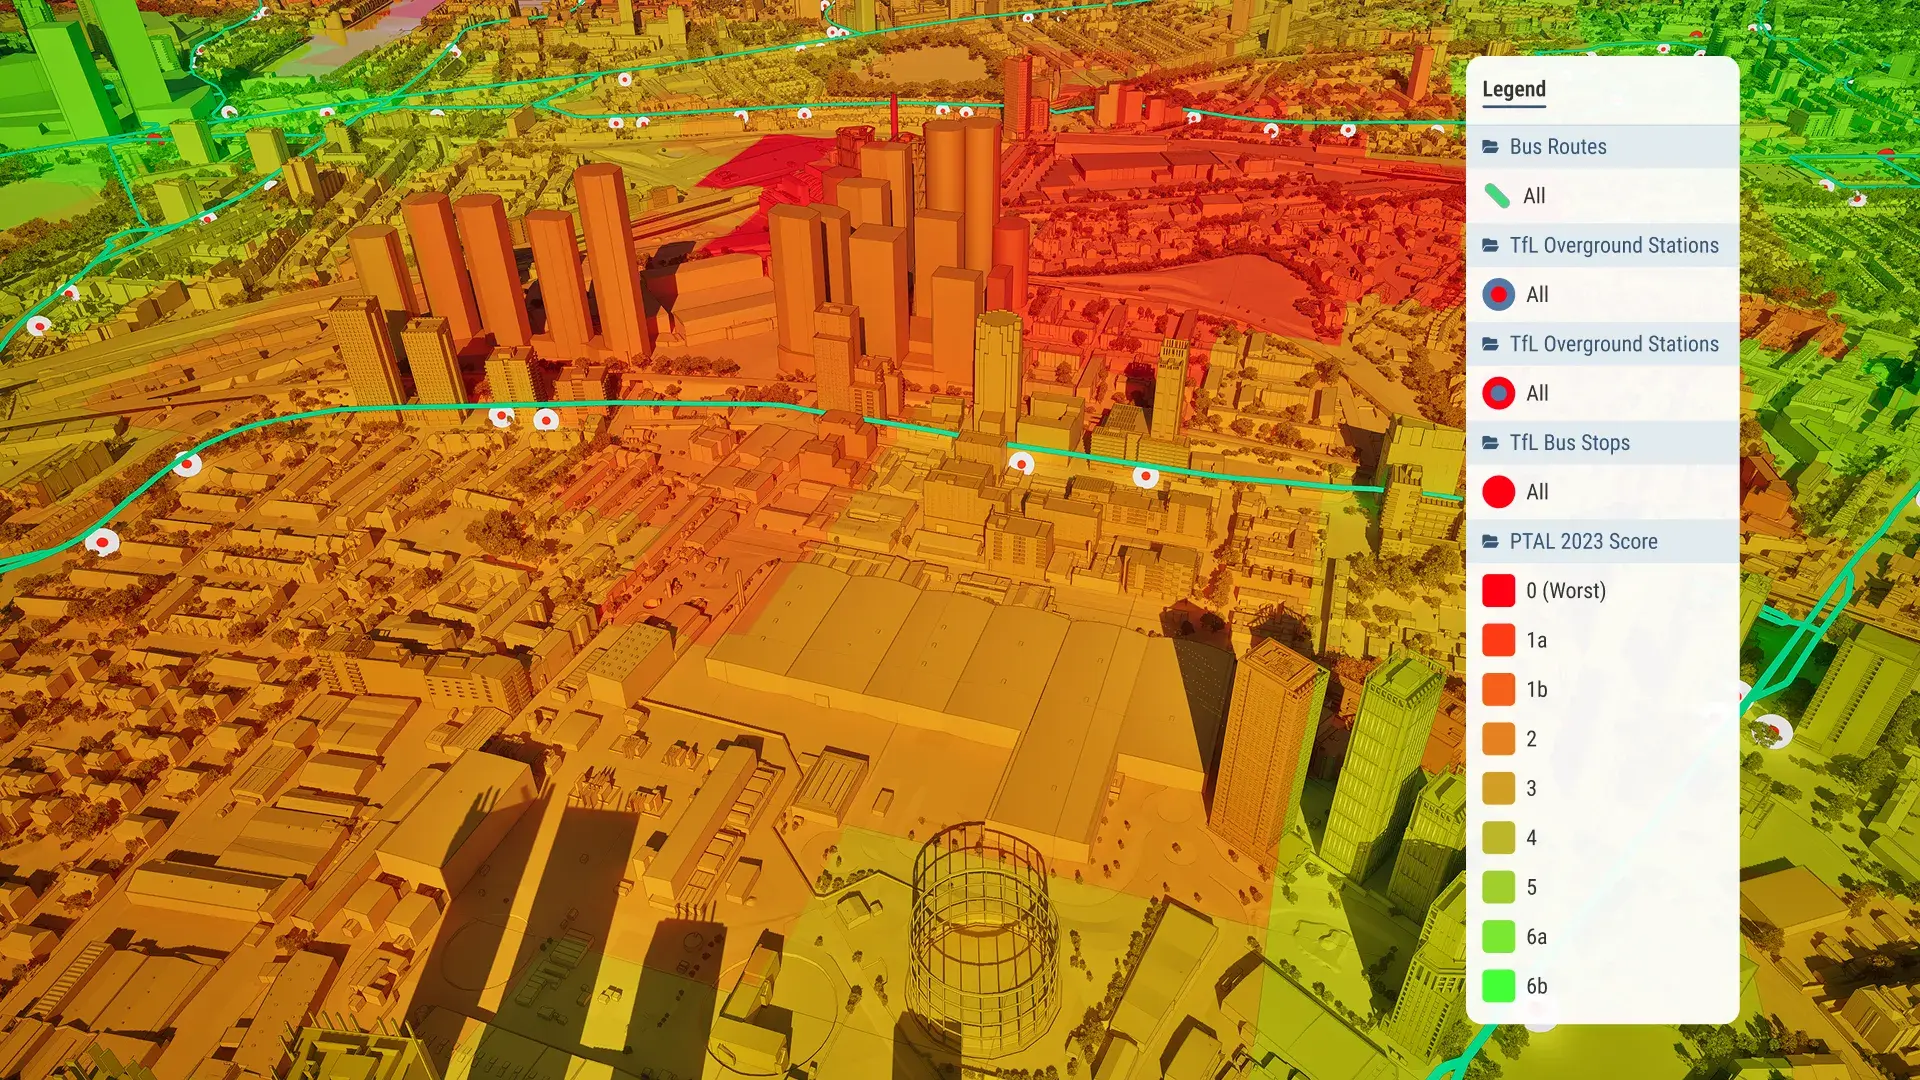
View transport links using public data in VU.CITY
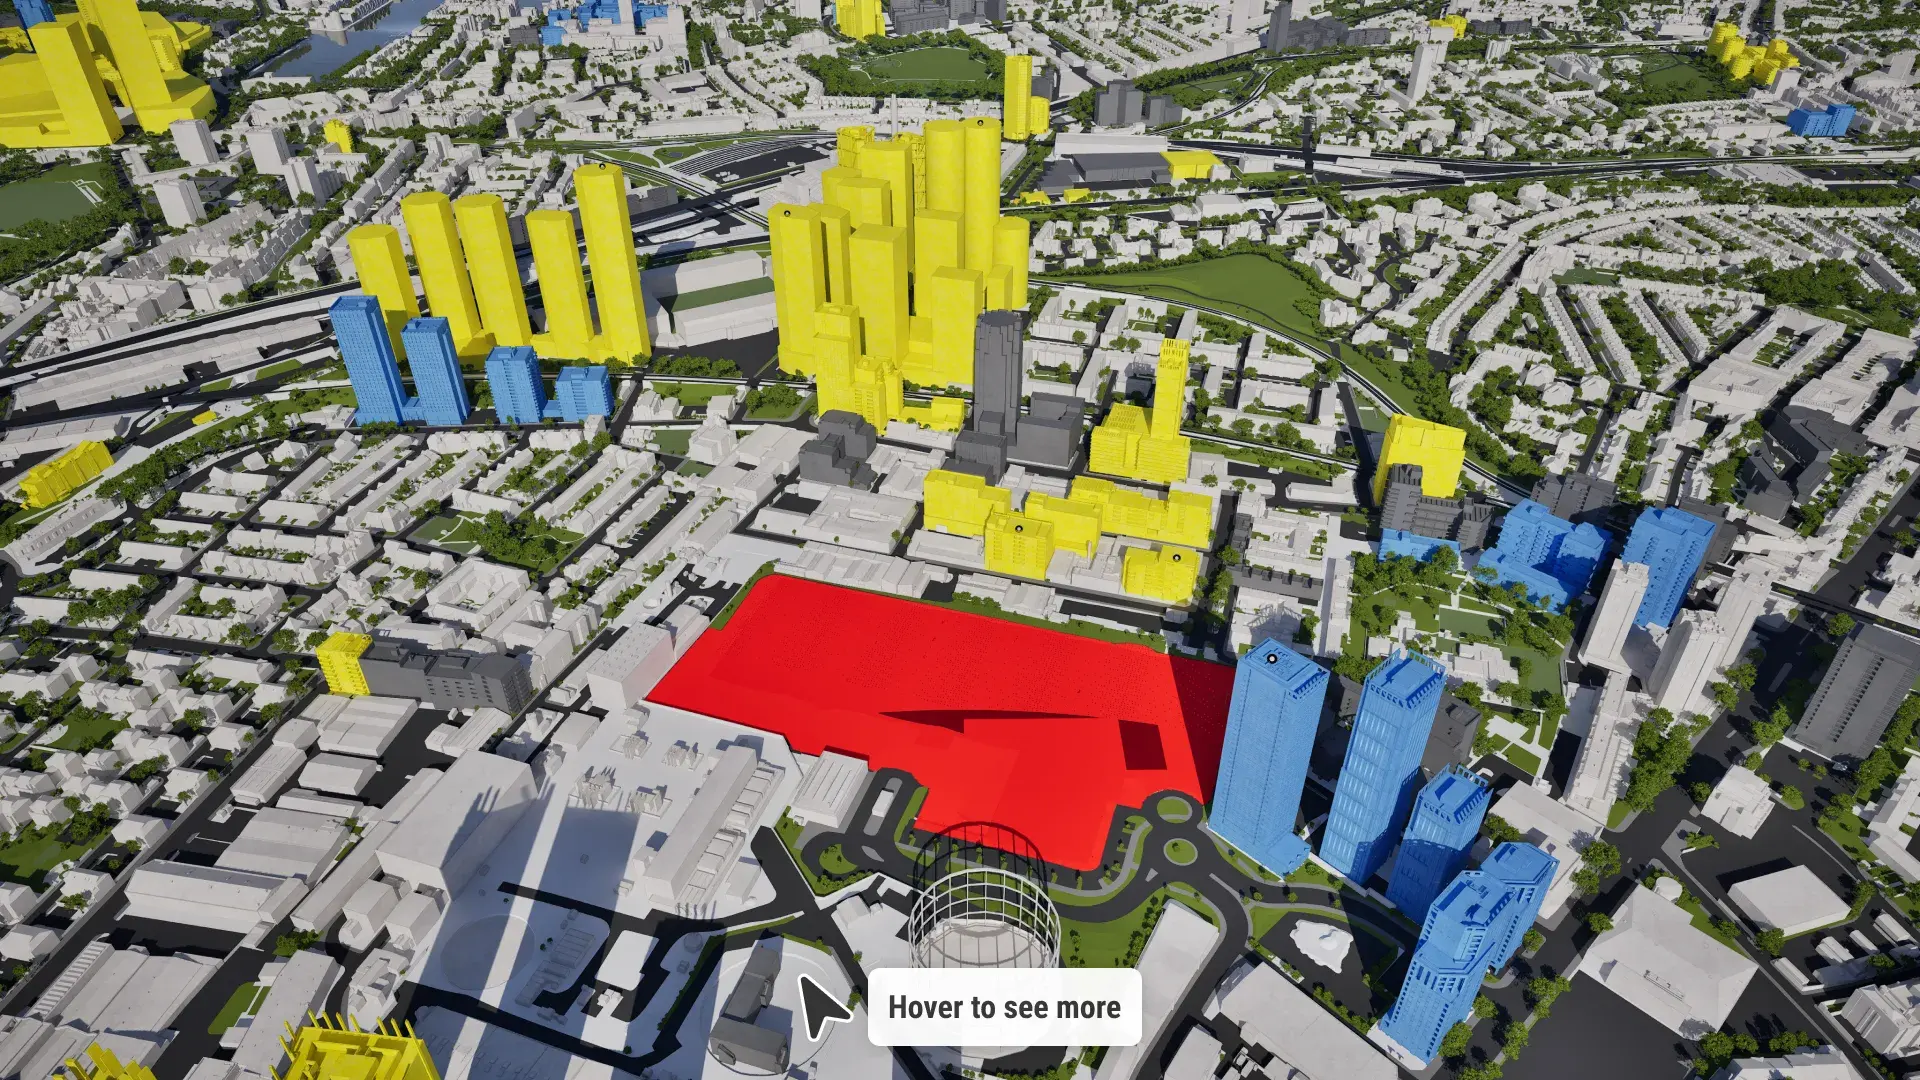
Agree site boundaries in VU.CITY

VU.CITY Camera Views

Visualise

View, edit and customise our maps and models. Import your own areas and objects. See the big picture.

See more →

VU.CITY 3D Data Layers

Understand

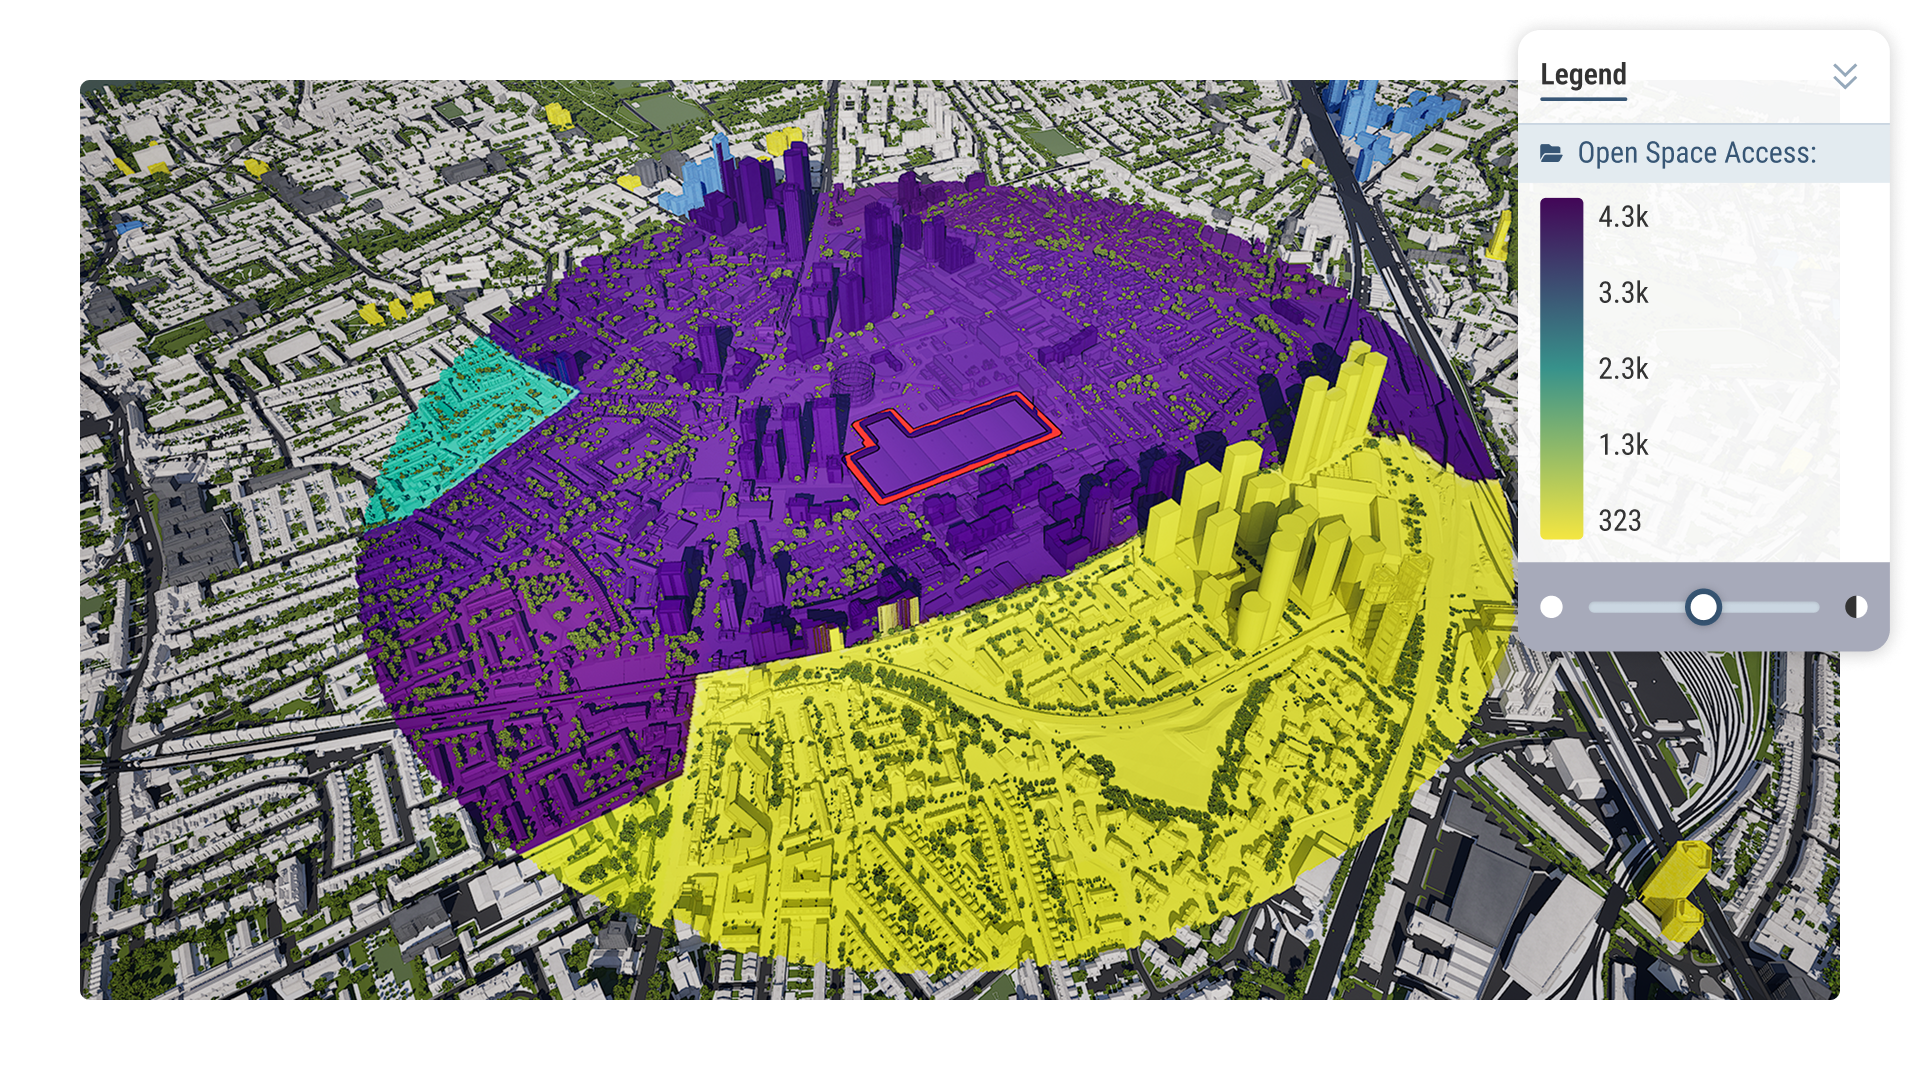
Gain visual context. Combine your own data with our library of overlays to uncover insights.

See more ↓

VU.CITY Presenter Tool

Communicate

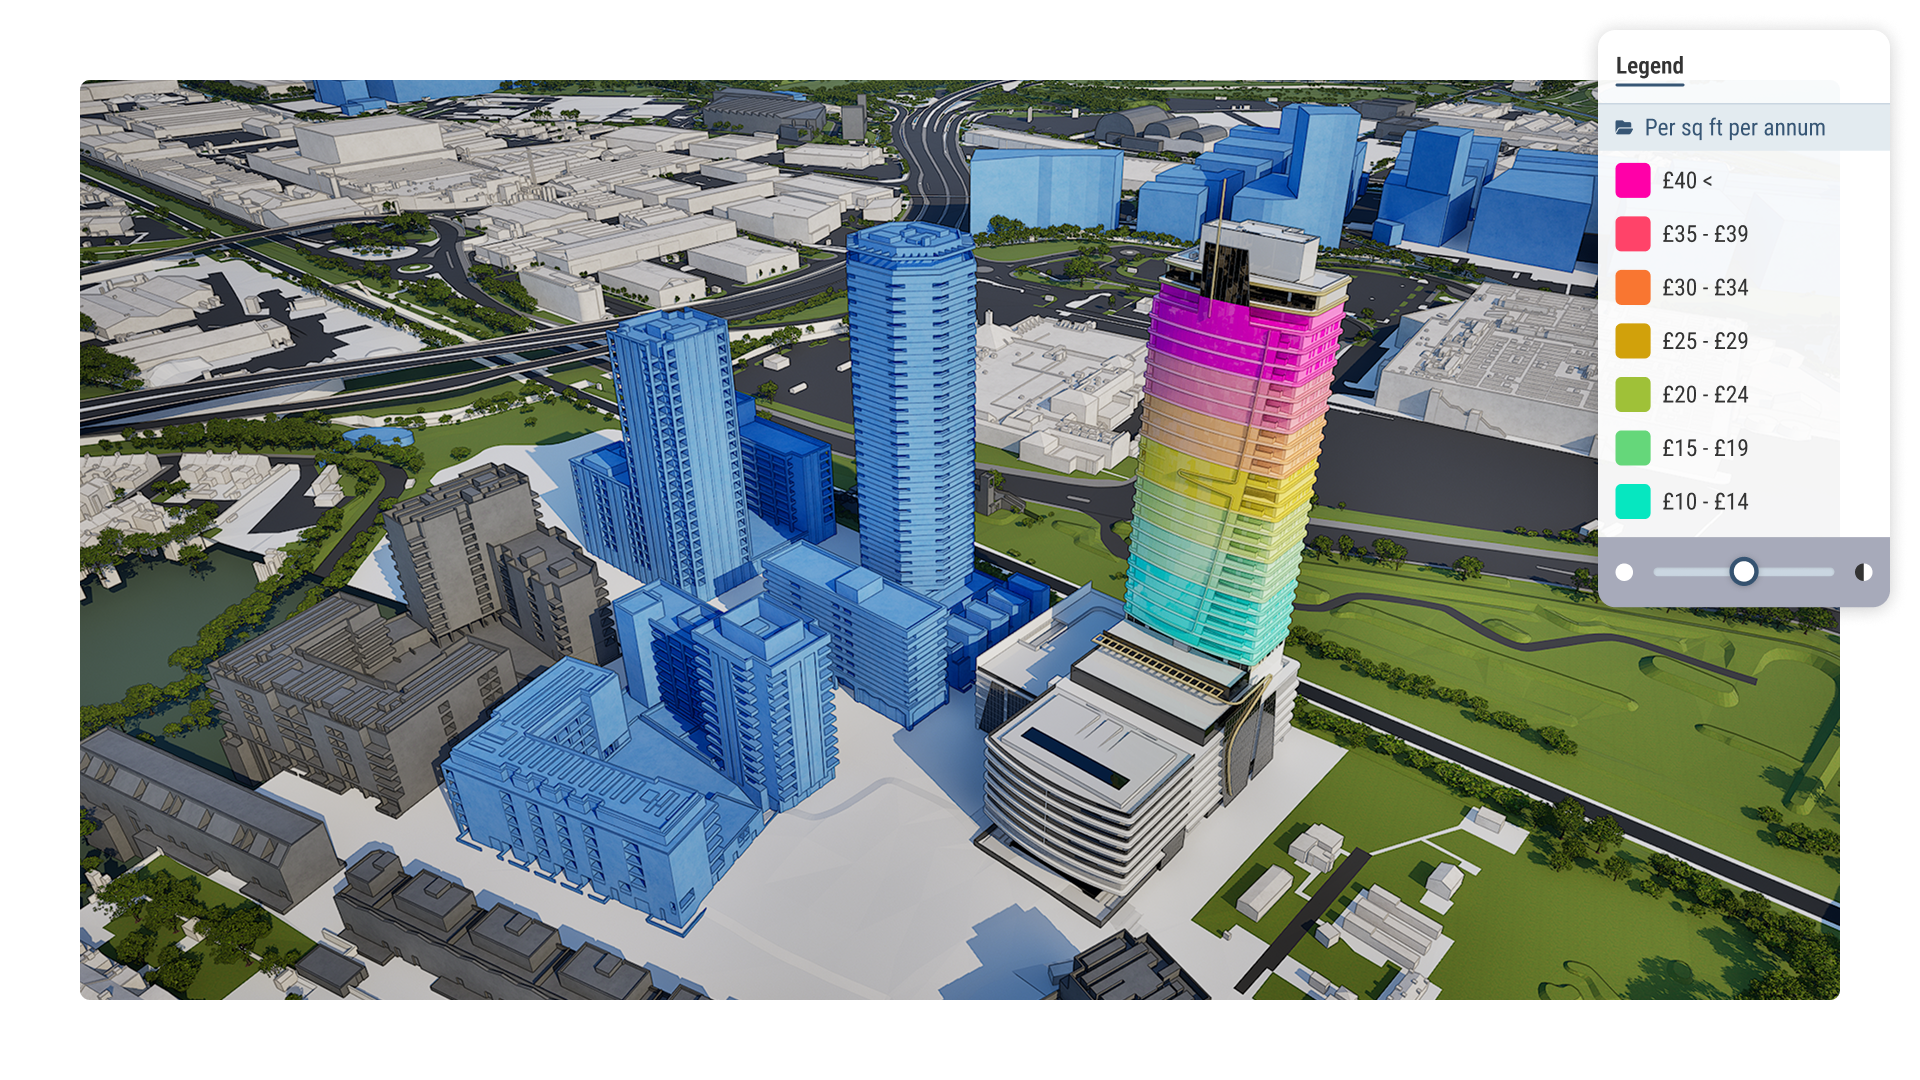
Generate high-quality imagery, or take your audience on an interactive, immersive tour.
See more →

Overlay and analyse any data

Import any data into VU.CITY

Import any data

Bring in data from any source, then layer it on our 3D canvas, in seconds.

No expertise needed to interrogate data in VU.CITY

No expertise needed

Our platform uses smart filtering and processing to recognise your data and configure it for you.

Visualise 2D & 3D data points, lines and areas in VU.CITY

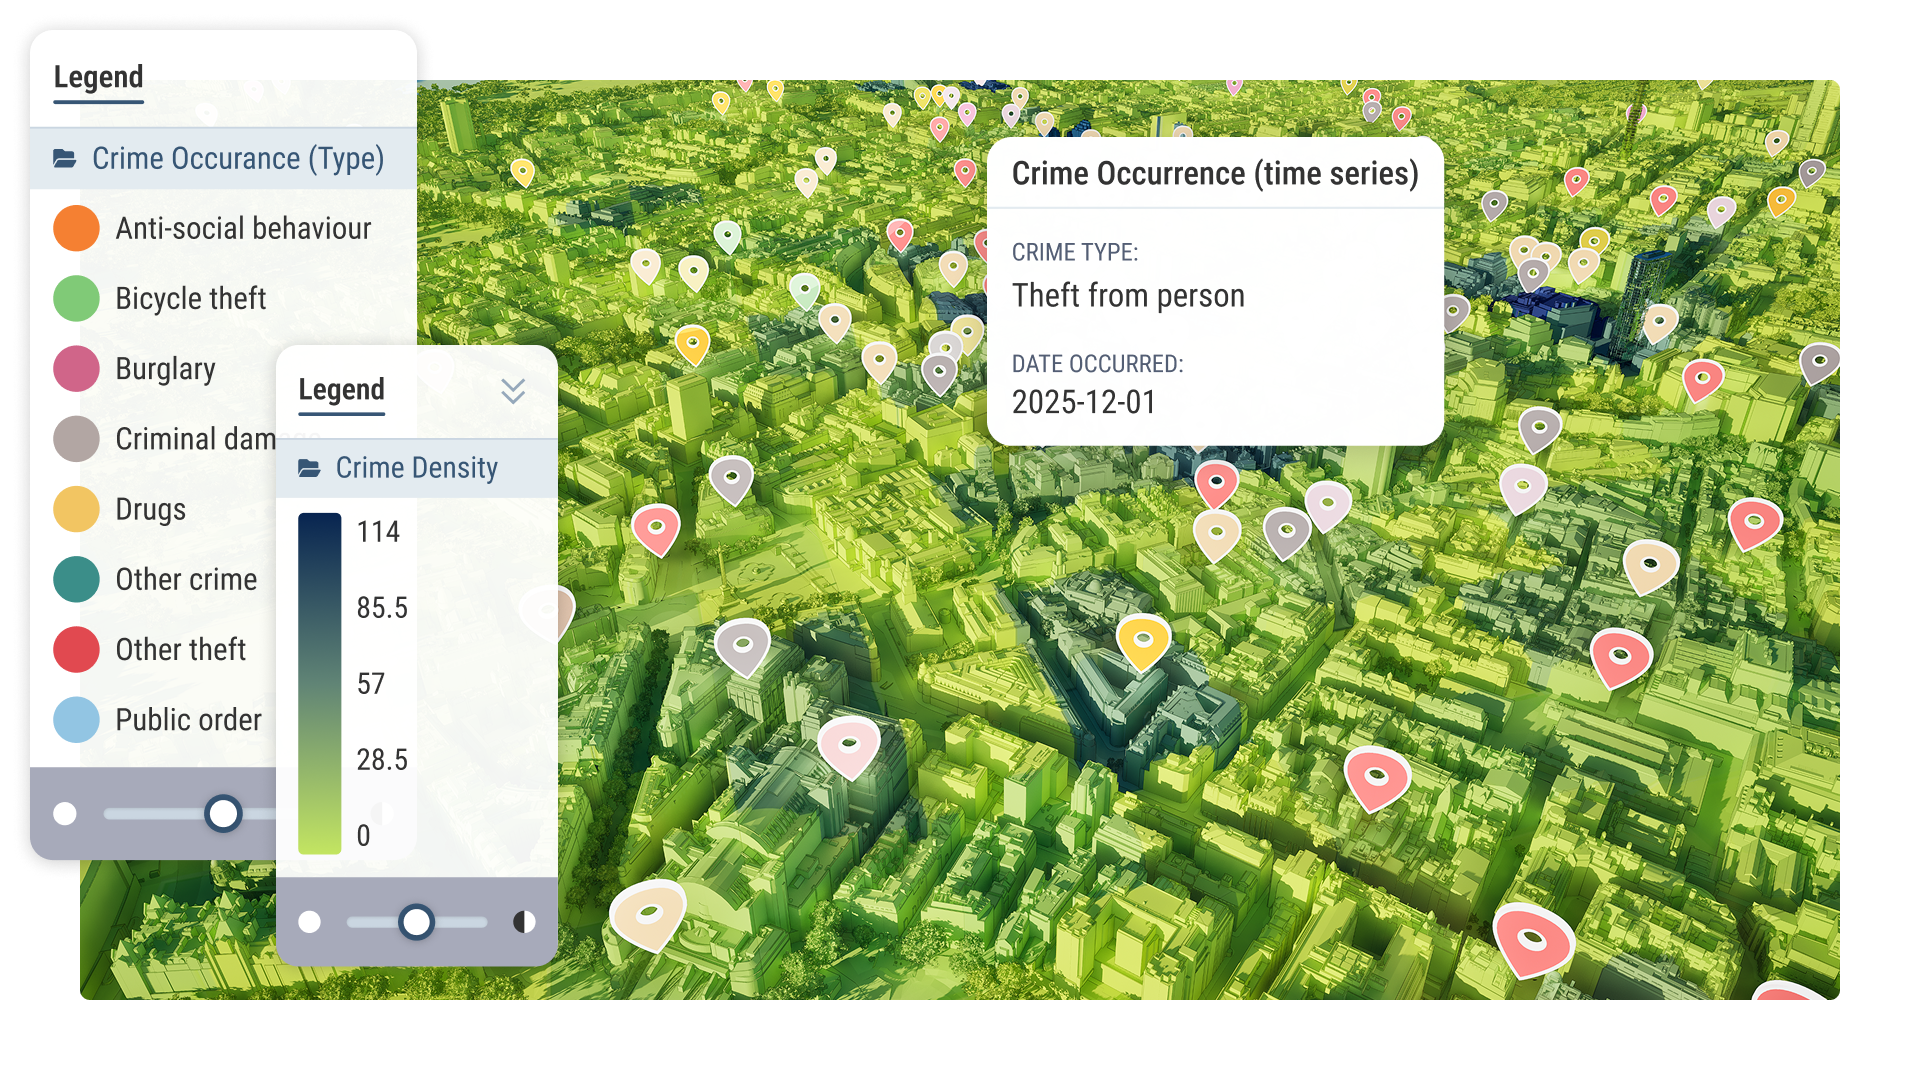
 Points, lines, areas, mesh, raster and time series

If you have the data, you can display it any way you like. 

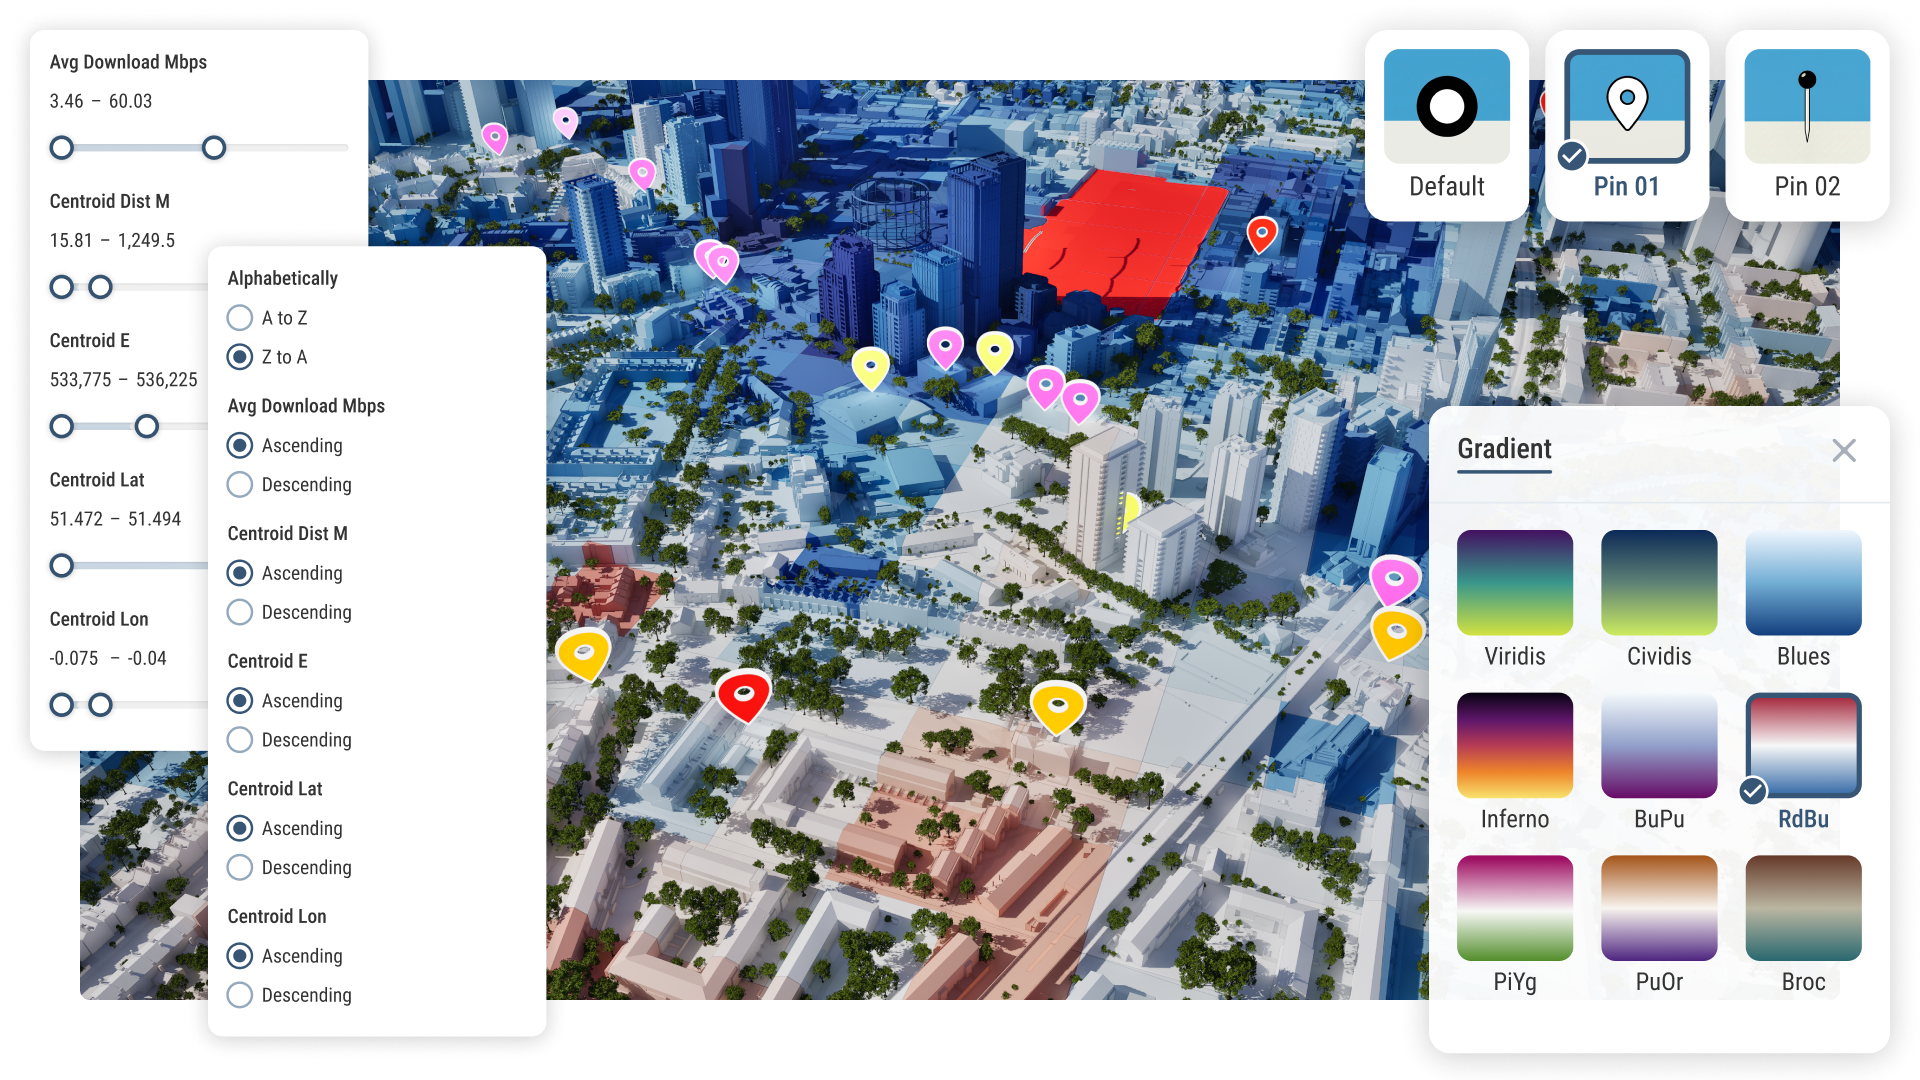
Customise and filter your data in 3D using VU.CITY

Custom filters and styling

Easily filter and sort your data. Visualise with brand colours and styles.

Out of the box: VU.CITY public data library

Our library of public data gives you a deeper contextual understanding of areas. 

Across our 26 cities, we provide a range of data from climate, population, transport and more.

We also provide government planning policies where available, alongside conservation and protected areas.

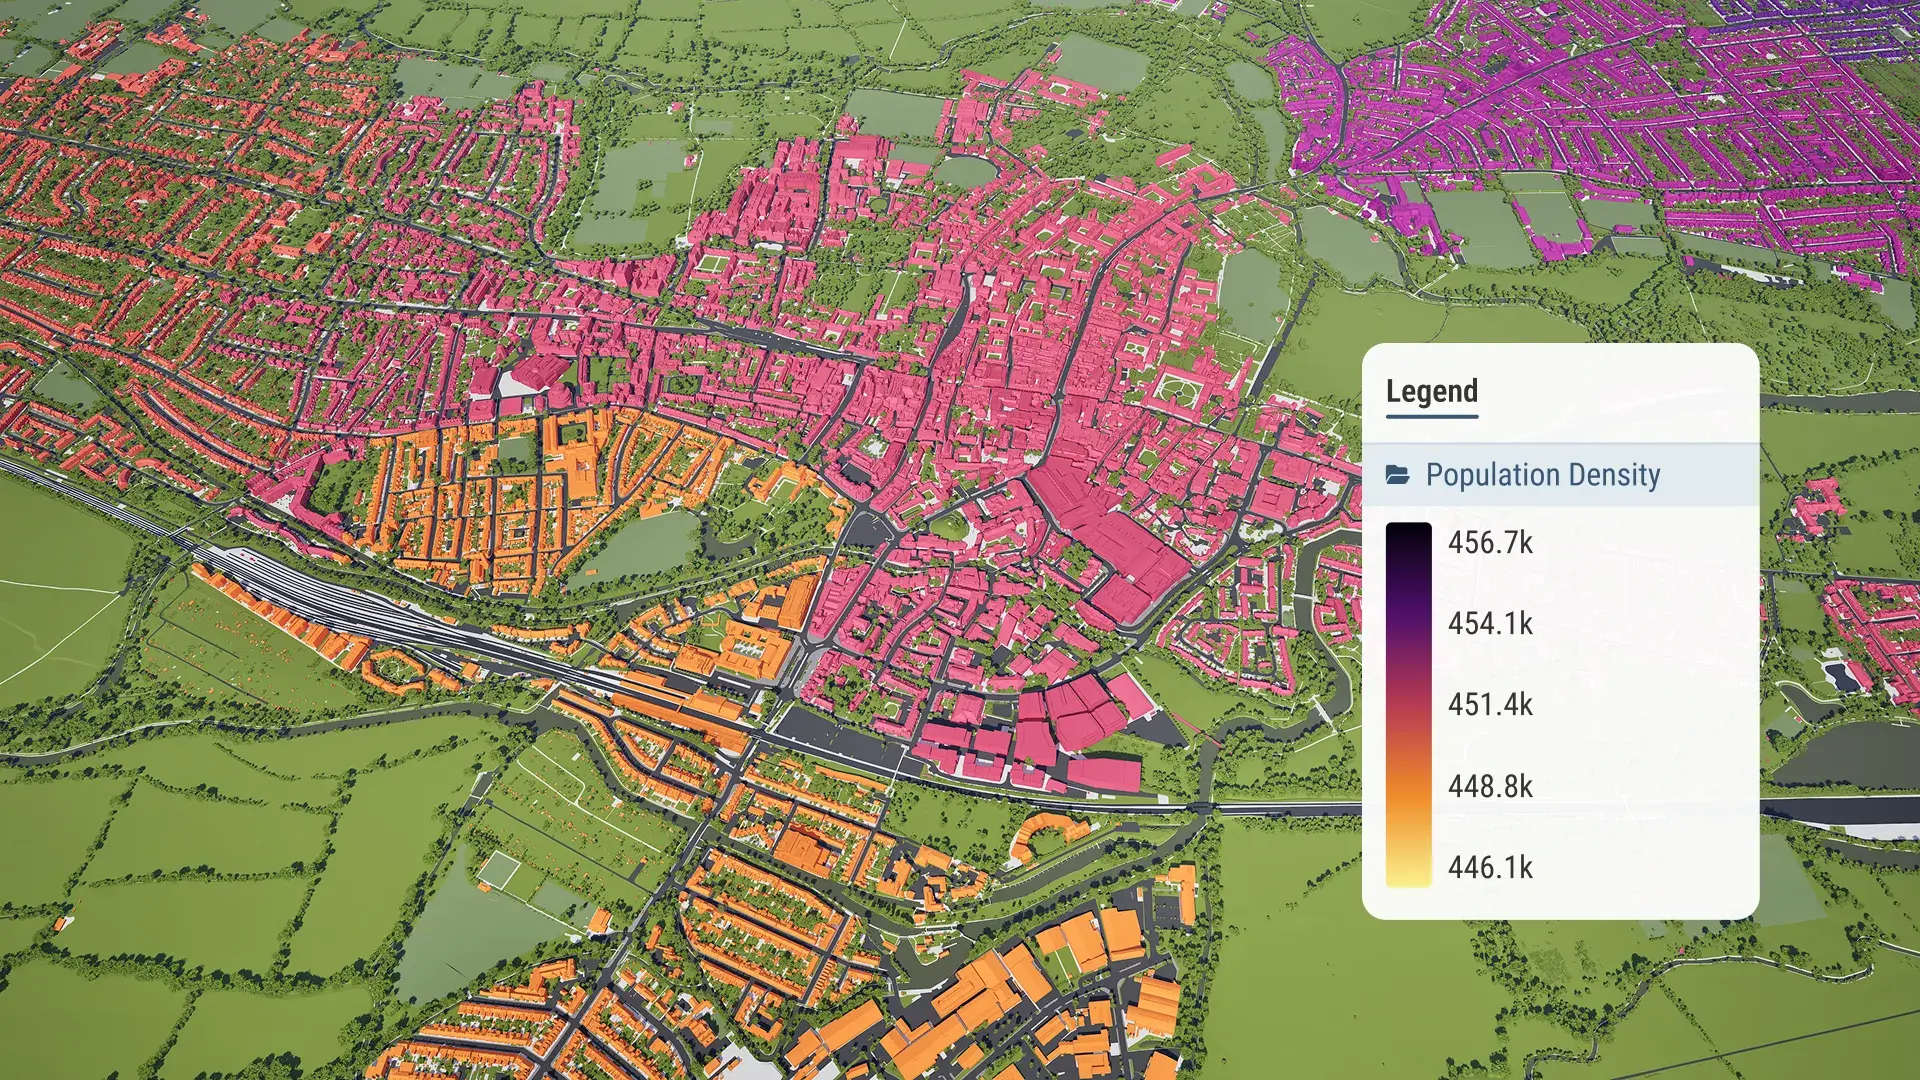
VU.CITY Oxford population density data layer shown on a 3D model
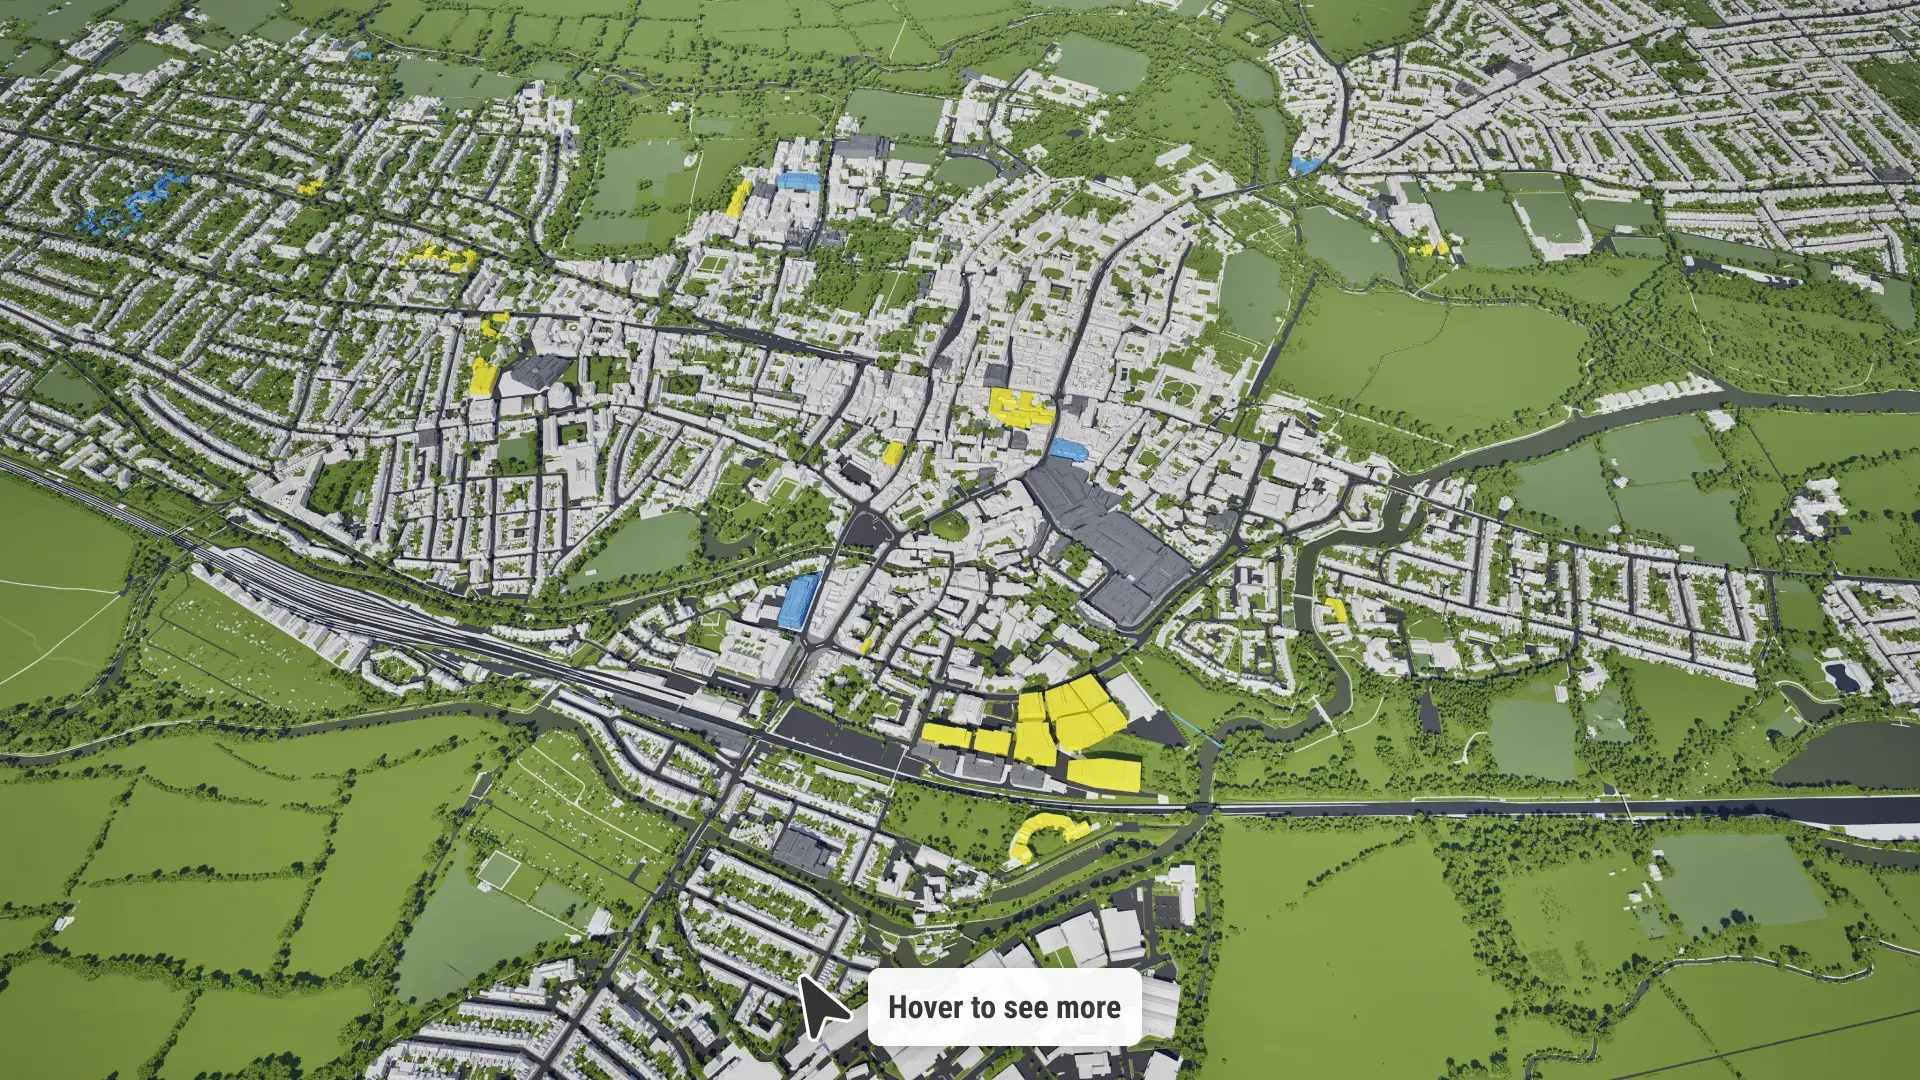
VU.CITY Oxford consented timeline

Find, create and test your ideas.

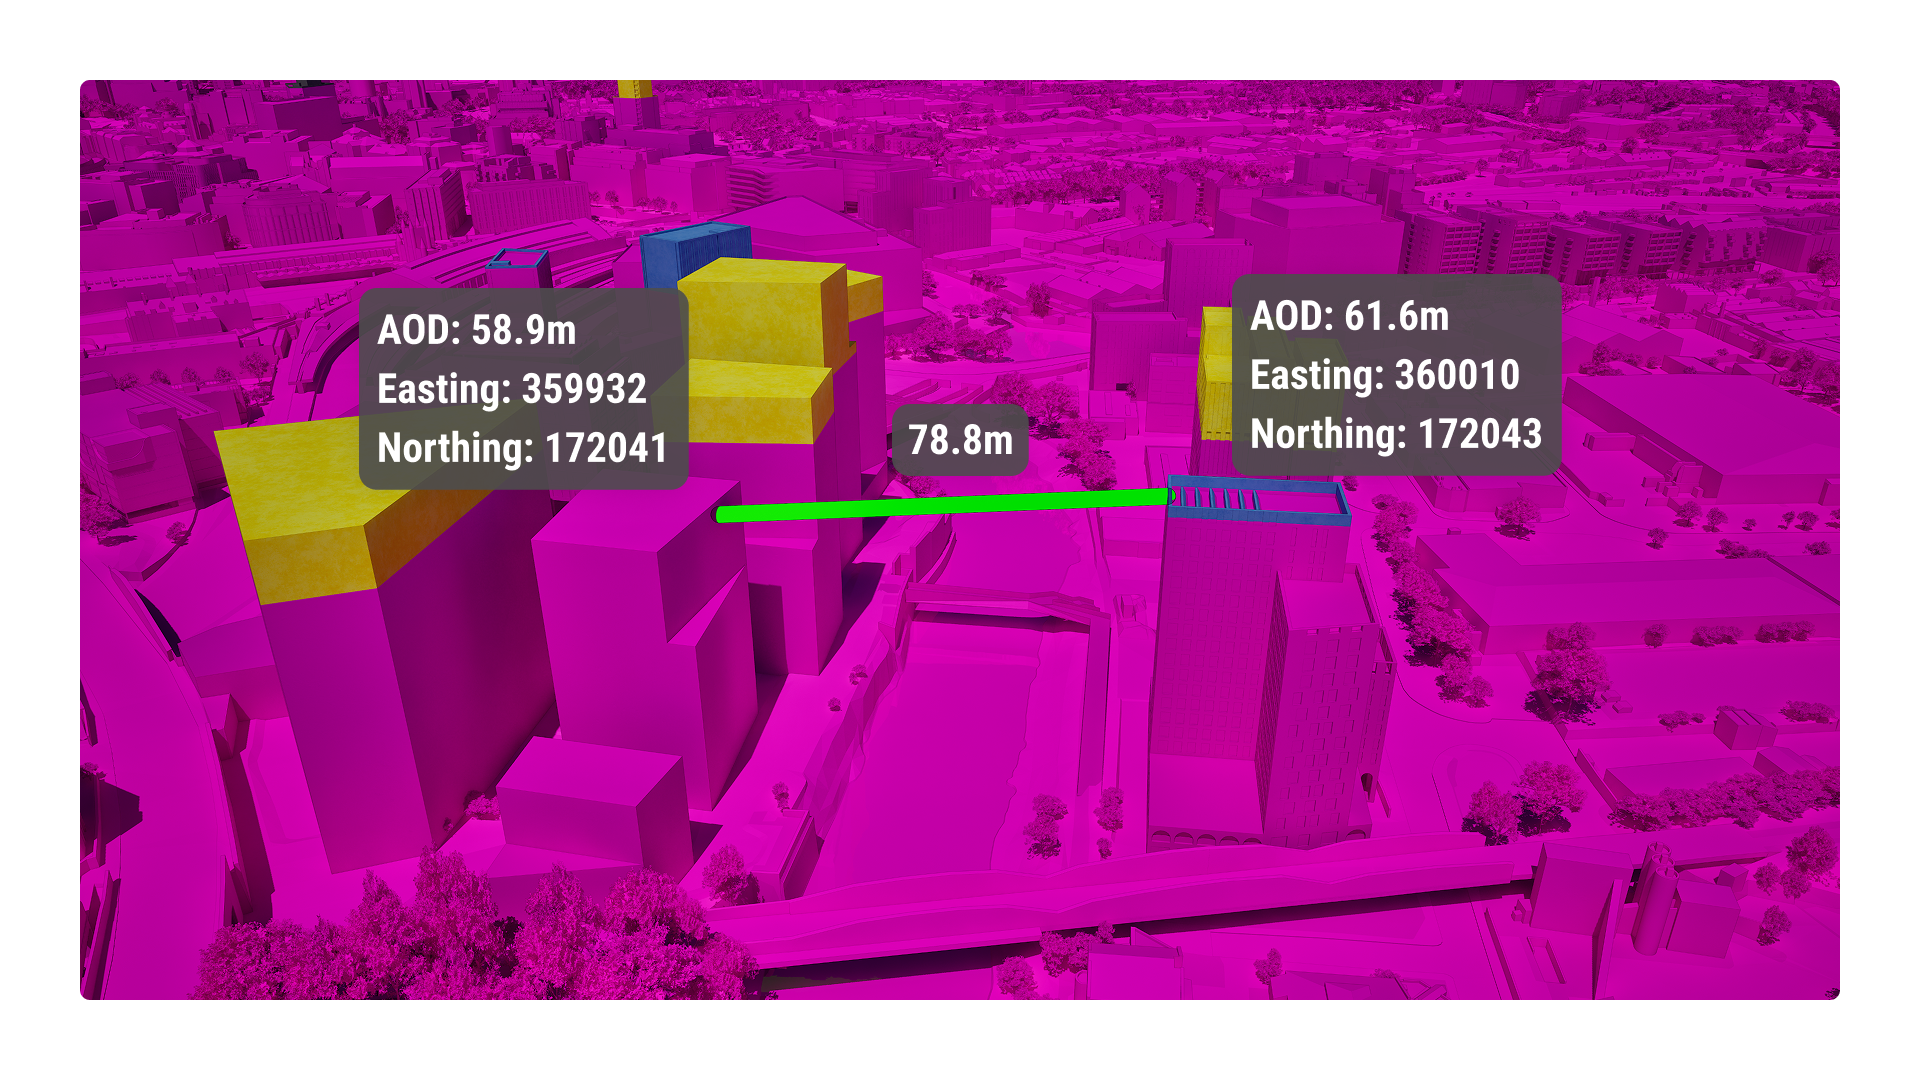
Measure accurately and annotate in 3D using VU.CITY

Measure and annotate

Work with accuracy - measure distance and height on a hyper-accurate map.

Ideate and iterate in VU.CITY

Ideate and iterate

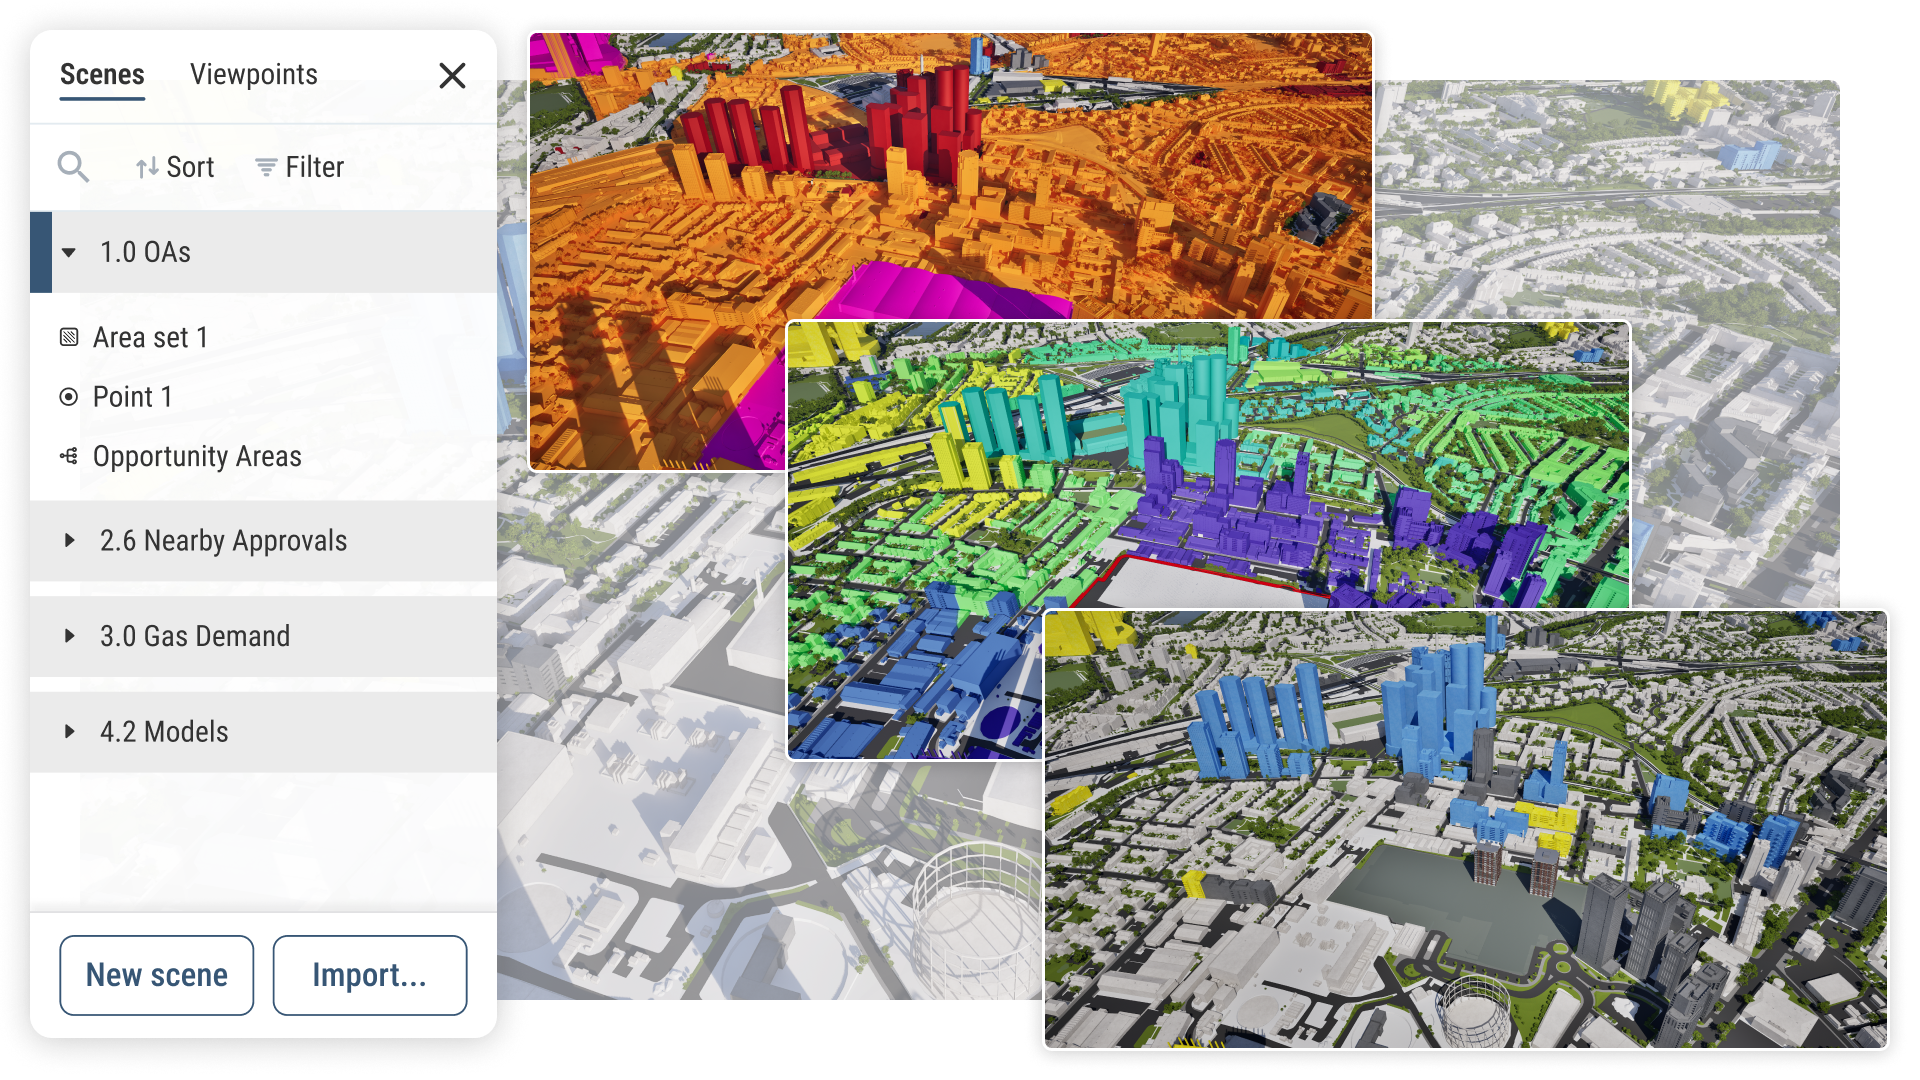
Our 'scenes' allow you to quickly compare versions and ideas, as many times as you like.

Sunlight paths and shadows in VU.CITY

Shadows and daylight

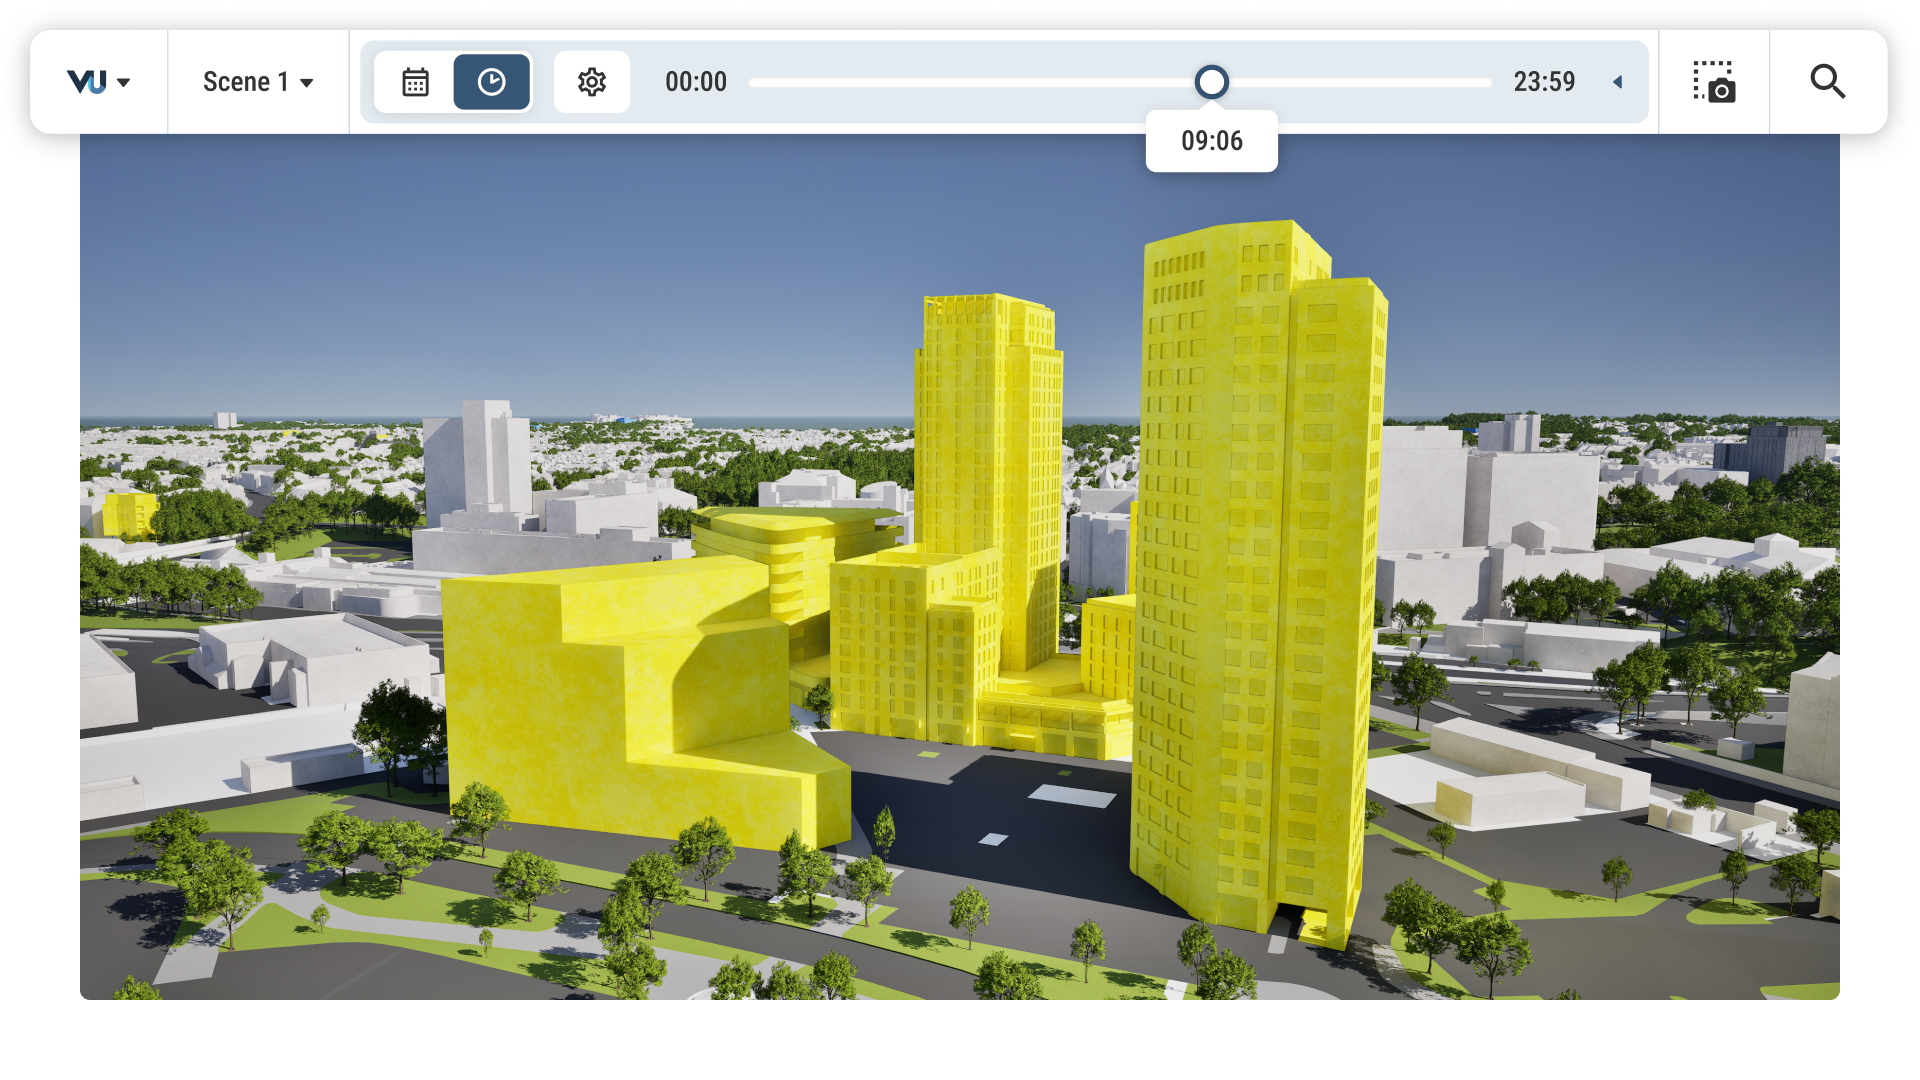
Predict overshadowing and natural light for any location, date and time.

Line of sight and views in VU.CITY

Test line of sight and views

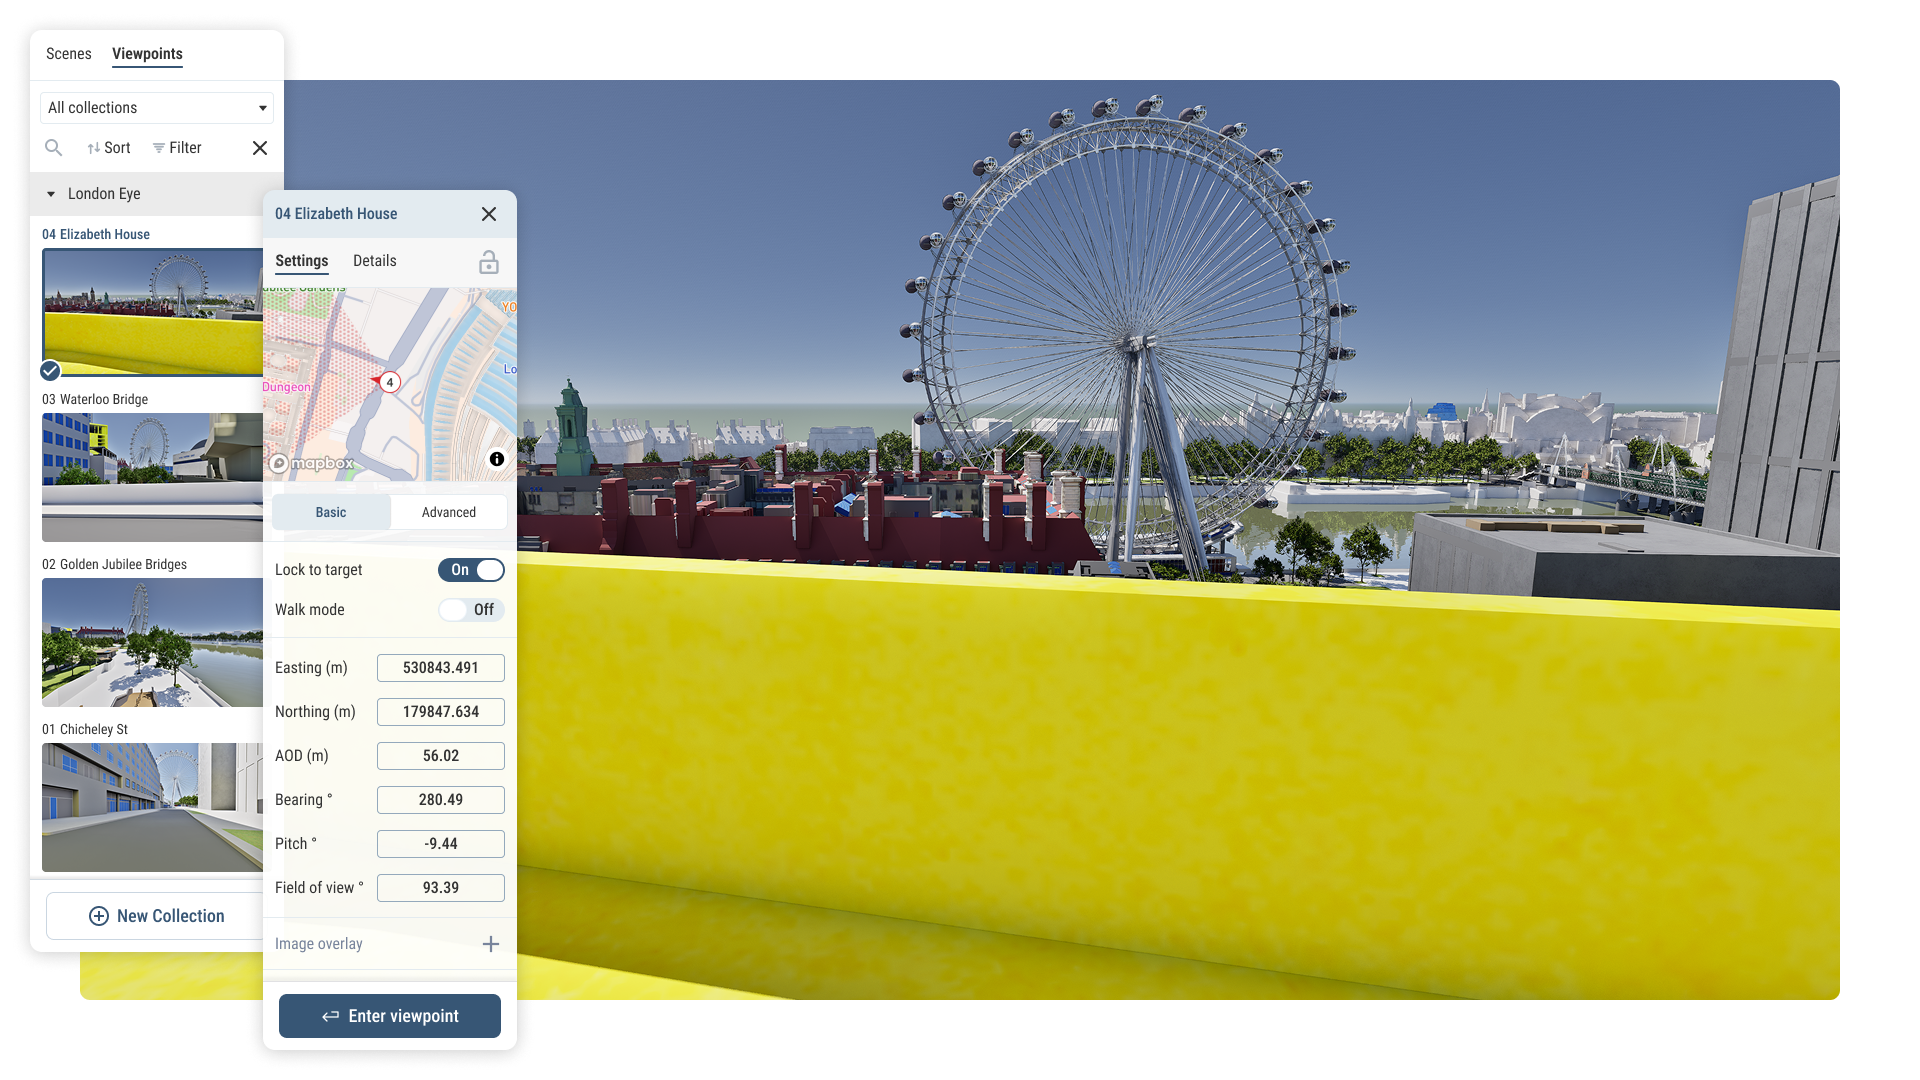
Set viewpoints, test sightlines and capture the perspective that makes your case.

Step into the 4th dimension: Time-series data

Our timestamped canvas gives you the ability to go beyond static data, graphs and maps to give your story more oomph.

With any data that has timestamps, you can scrub through seconds, months or years and and watch changes happen in real-time.

Uncover trends, analyse cause and effect, and present your findings in a compelling format anyone can follow.