The built environment has reflected societal advancements since the beginning of time. As we fast-forward through centuries of human and technological progress to the present day, we find ourselves at the crossroads of architectural evolution and data visualisation.
Let’s delve deeper into the importance of data visualisation in building design and what it means for the future.


How data visualisation is reshaping architecture
The role of data visualisation in architecture is becoming more essential by the day. As building designs, and their surrounding environments, become more complex and intertwined with technology, the practicality of visualising design data becomes a question of “how soon” not “why”. As in, architects and urban developers are no longer questioning the usefulness of data visualisation, they are only thinking of how soon they can start using it when they begin a new project.
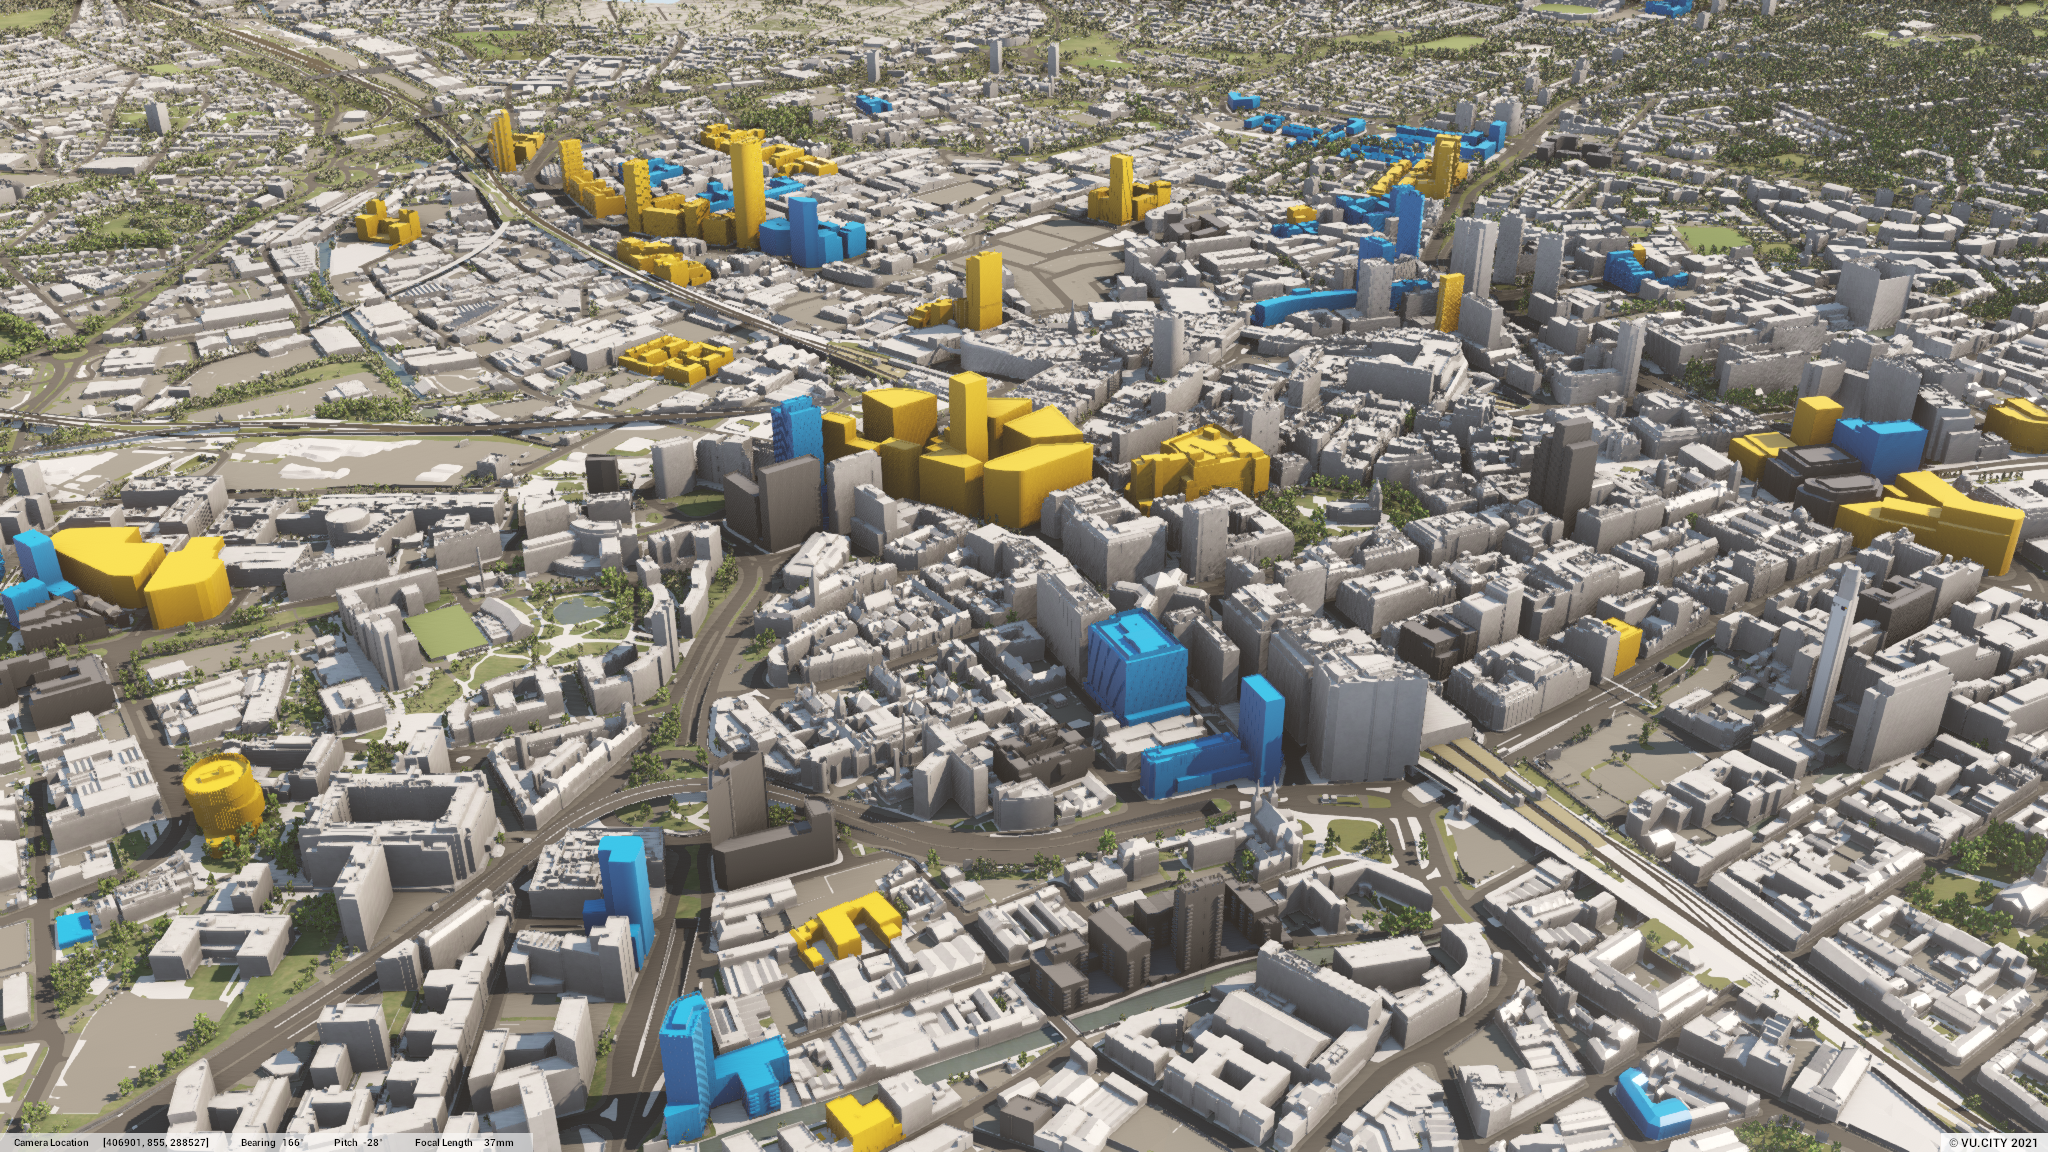
This shift has not only streamlined the working process. The right data visualisation software is sophisticated enough to portray environments and neighbourhoods in ways previously unimaginable. 3D data visualisation in building design, for instance, allows architects to get the full understanding of the precise location of their project from multiple angles.
Similarly, using a wide range of data layers from public and private sector sources, architects can craft smarter and more practical structures, offering a tangible feel for where and how the building will blend into its new surrounding before a single brick is laid.
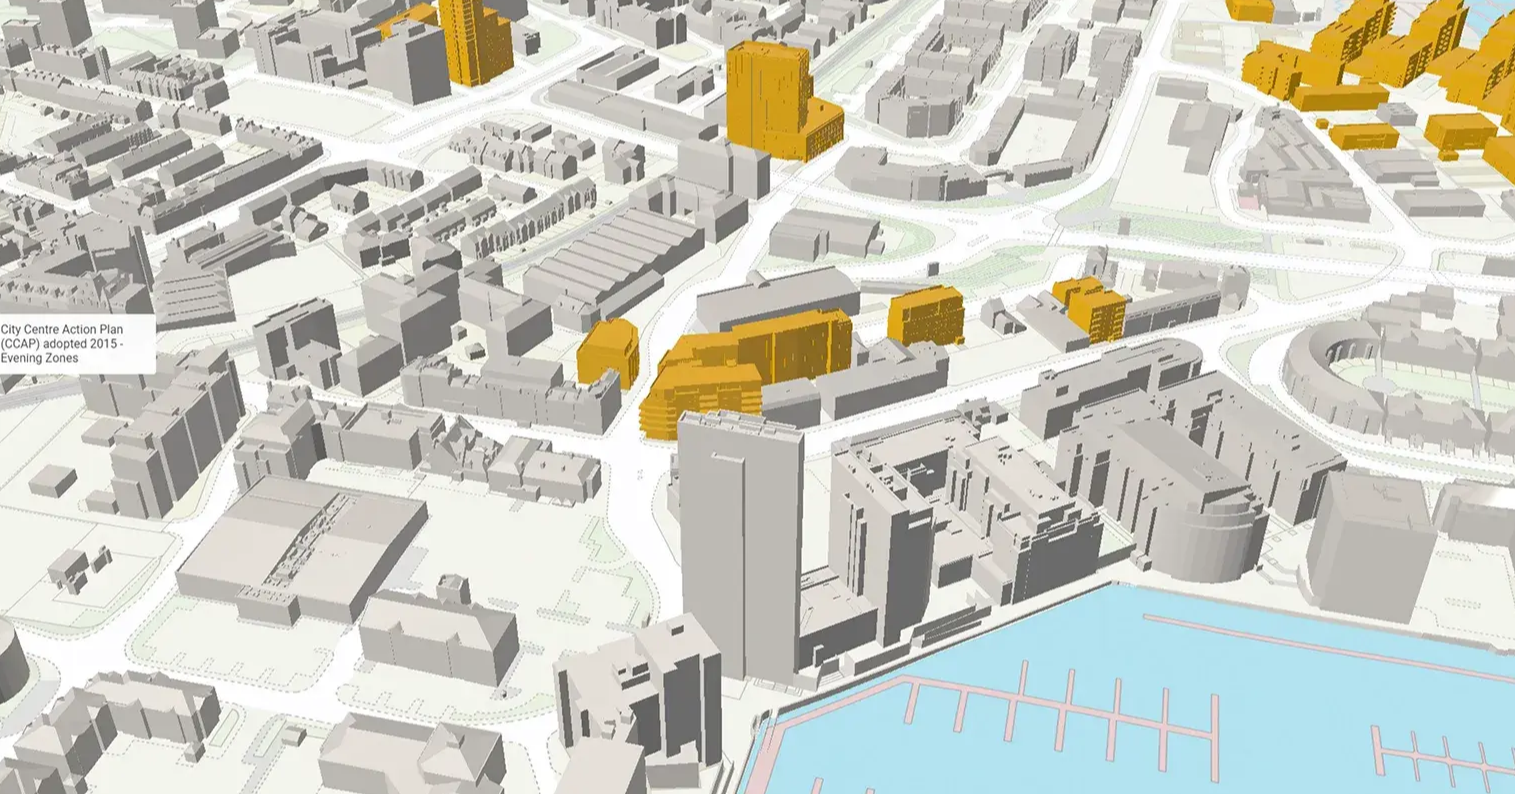
💡 For example, timeline data layers can visualise all past, present, and future developments in a specific area; providing details about each project that would otherwise take hours of manual research to collect.
How It All Began
Architectural evolution and data visualisation have their origin in rudimentary hand-drawn sketches and blueprints. While these traditional methods provided a foundation, the introduction of computer-aided design (CAD) tools was a game-changer.
Today’s architects, planners and developers can visualise the built environment of their project, play around with views and data layer elements, and predict outcomes with far greater accuracy than ever before. Read more about why data visualisation is an essential tool in the architect’s toolbox here.
Using visualisation to improve performance and efficiency
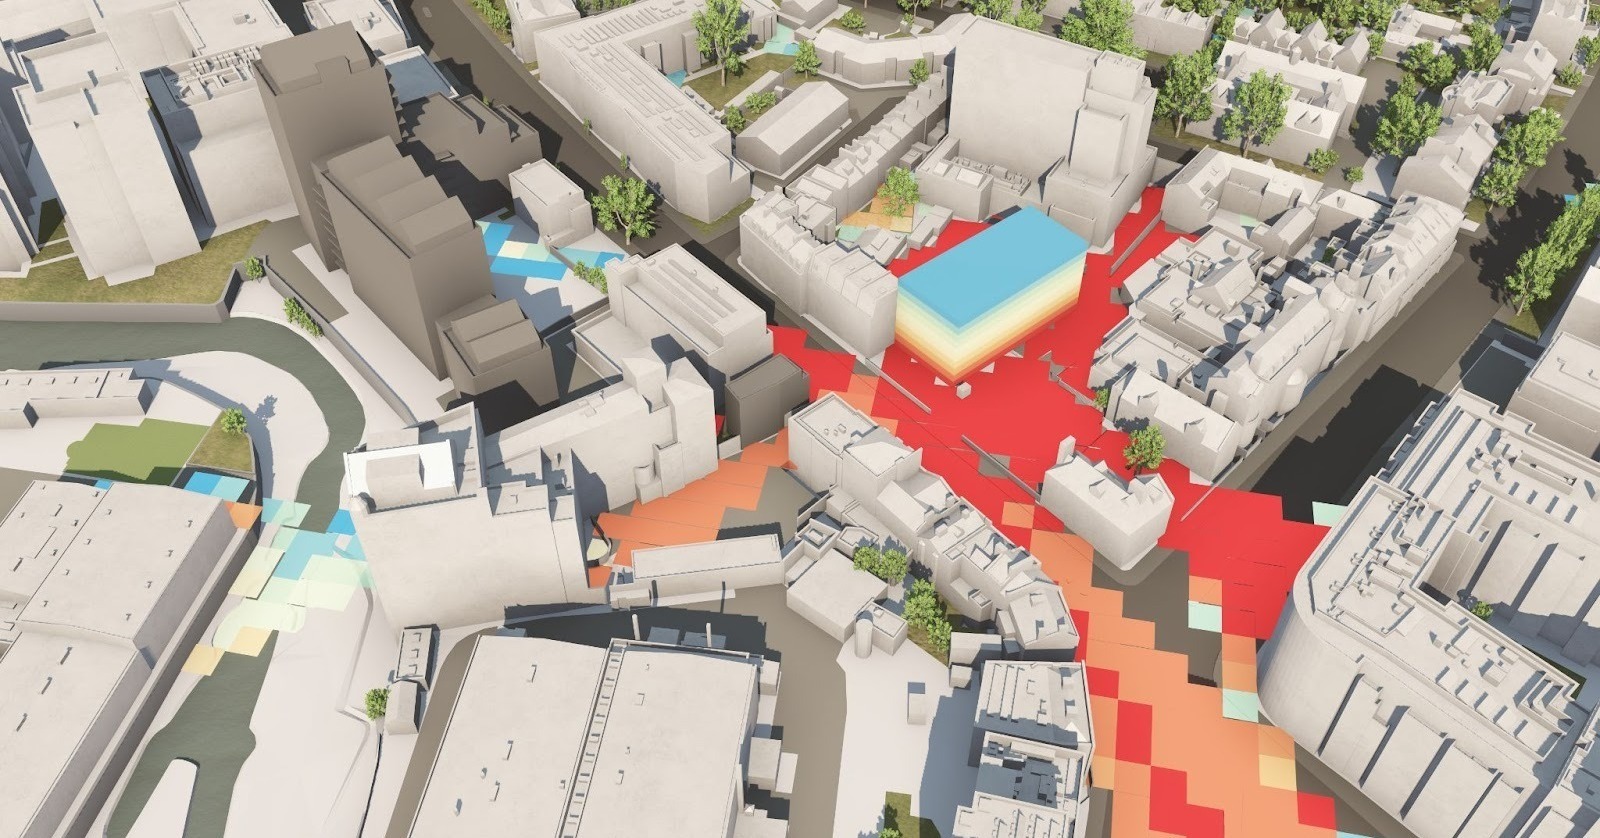
During the evolution of architectural technology, building design and data analysis have become intertwined, allowing architects to predict a building's performance in real-life conditions. Interactive data visualisation in architecture facilitates real-time feedback, ensuring that the structure is not just aesthetically pleasing but also functionally optimal, ticking every regulatory box necessary.
Data-driven building design also aids in optimising materials, understanding environmental impacts, and predicting public interactions, all leading to more sustainable and people-centric constructions.
what's next?
As the architectural field continues to embrace the importance of data visualisation in building design, the future looks promising.
As technologies like virtual reality and augmented reality become more sophisticated, they will continue to redefine architectural data modelling and visualisation. These tools, combined with machine learning and artificial intelligence, will push boundaries, paving the way for buildings that are not only sustainable but also in harmony with their surroundings.
Check out our suggested reading below to discover how data visualisation tools can elevate your next project.
Further reading:
Why Data Visualisation is Essential for Architectural Planning and Design
Harnessing the Power of Data Visualisation in Modern Architectural Design
VU.CITY Case Studies
See how leading built environment experts are using VU.CITY
-1-1-1.png)

Shape Tomorrow’s Cities, Today.
Begin Your Free Trial Now.