Nottingham 3D Model
Our model’s functionality and rich data layers help reduce design and planning uncertainty for development projects in the city known as the Queen of the Midlands. By utilising Nottingham’s 3D Digital Twin, planners can highlight potential impact and speed up crucial decisions.
With VU.CITY’s accurate and immersive 3D digital twin sophistication of Nottingham, all stakeholders can collaborate seamlessly, making smarter decisions and giving their project the best chance at success.
-
62DATA LAYERS
-
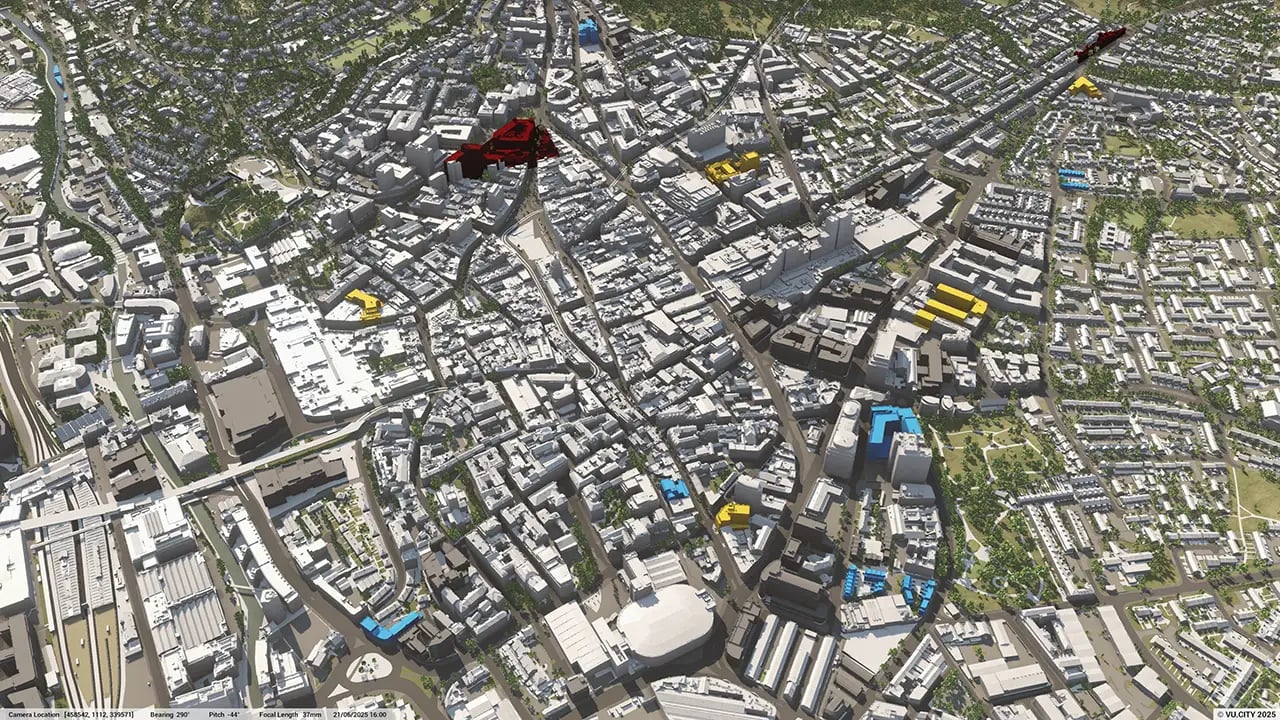
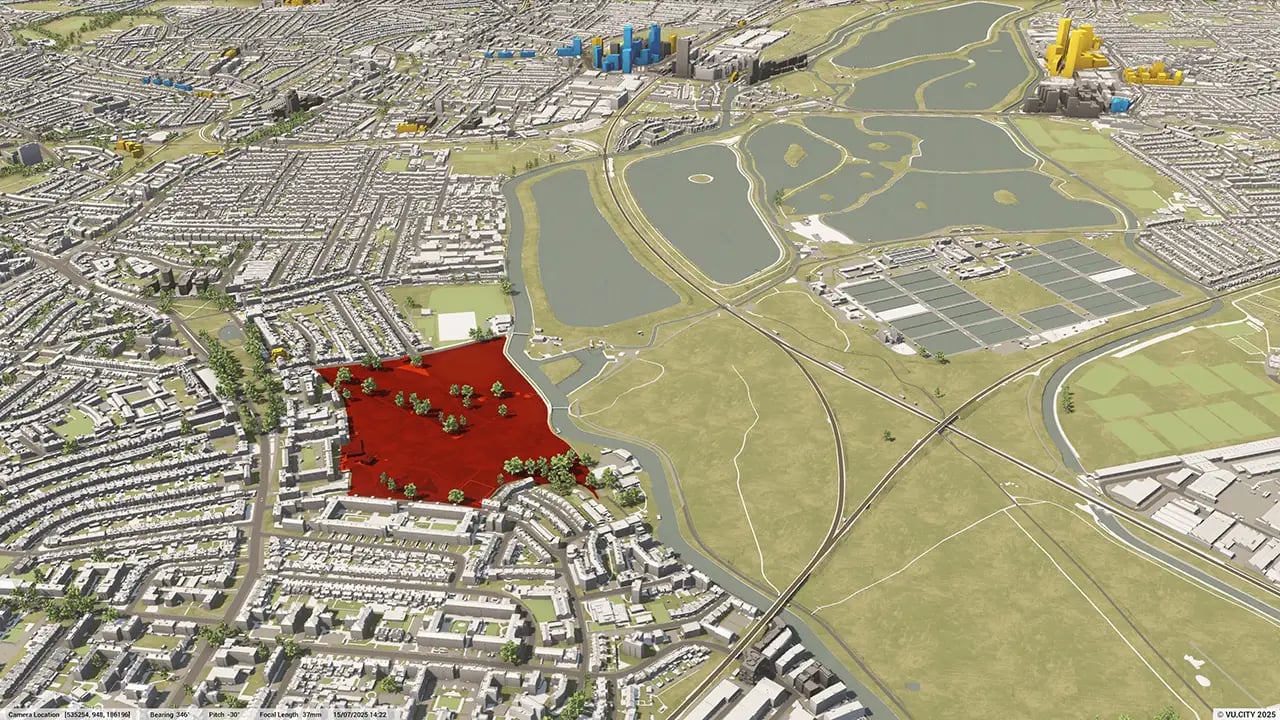
27 sq kmMODELLED TO 15CM ACCURACY
-
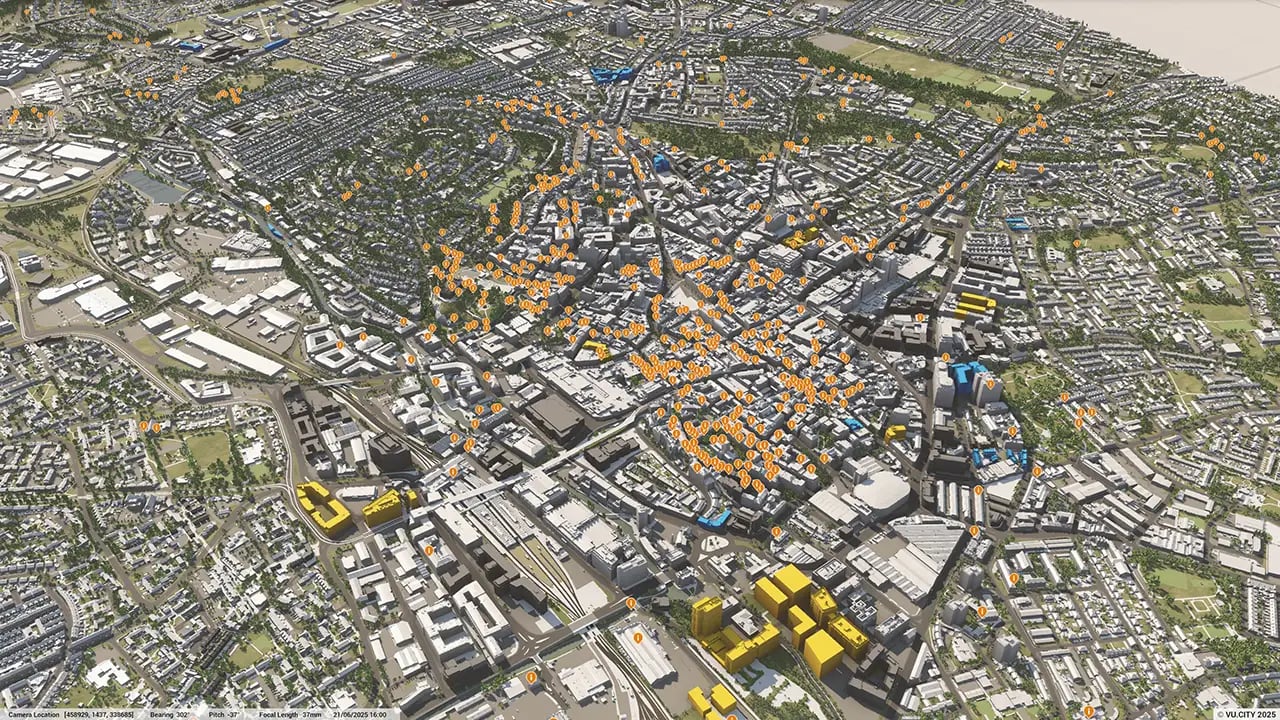
106Consents approved VU.CITY
-
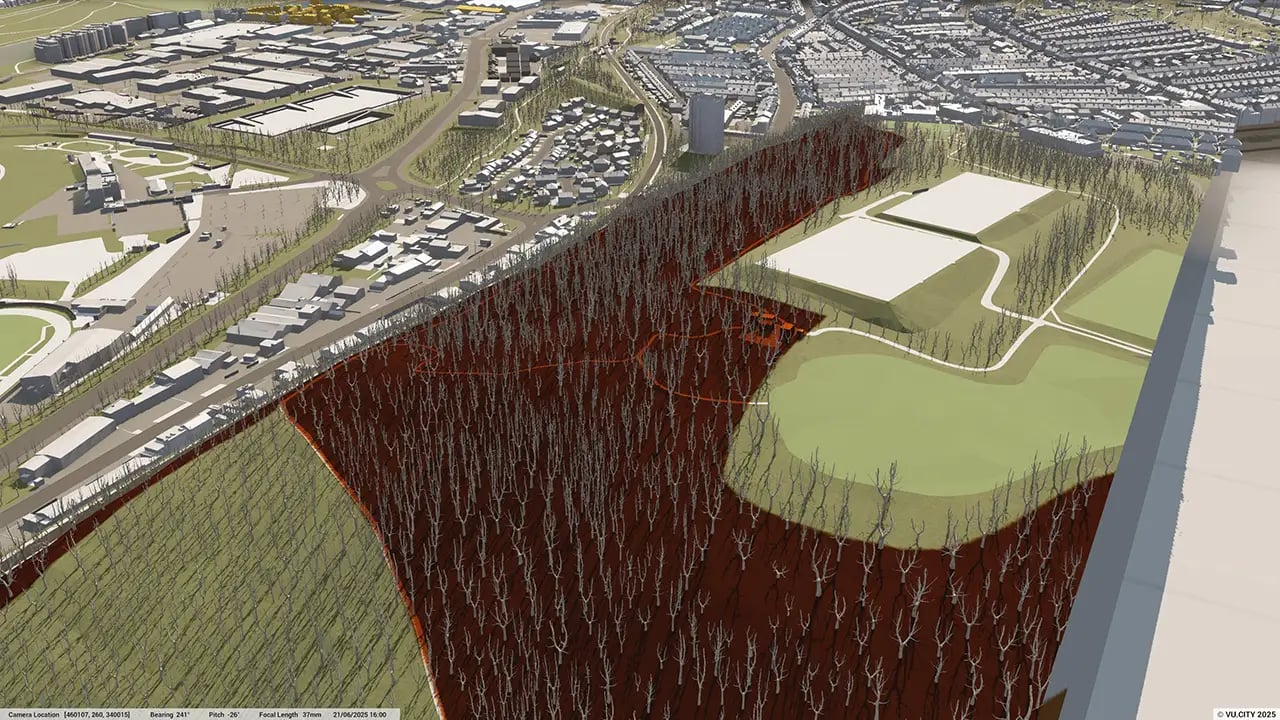
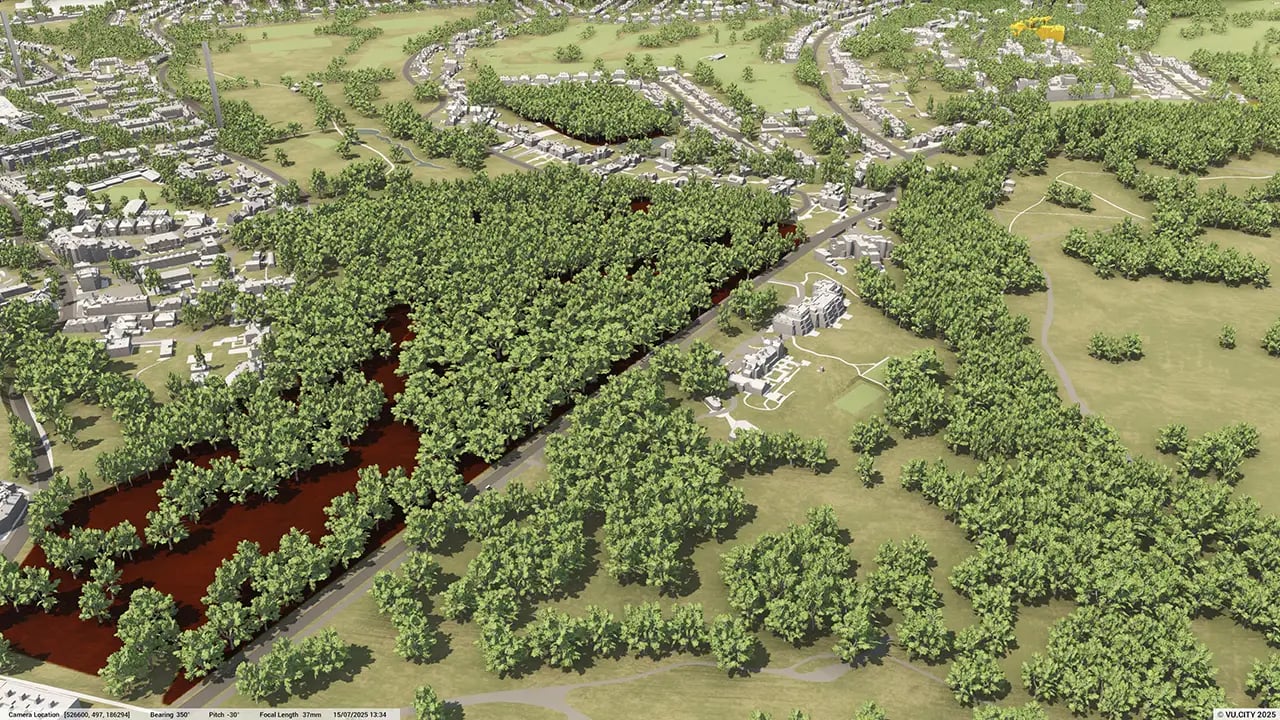
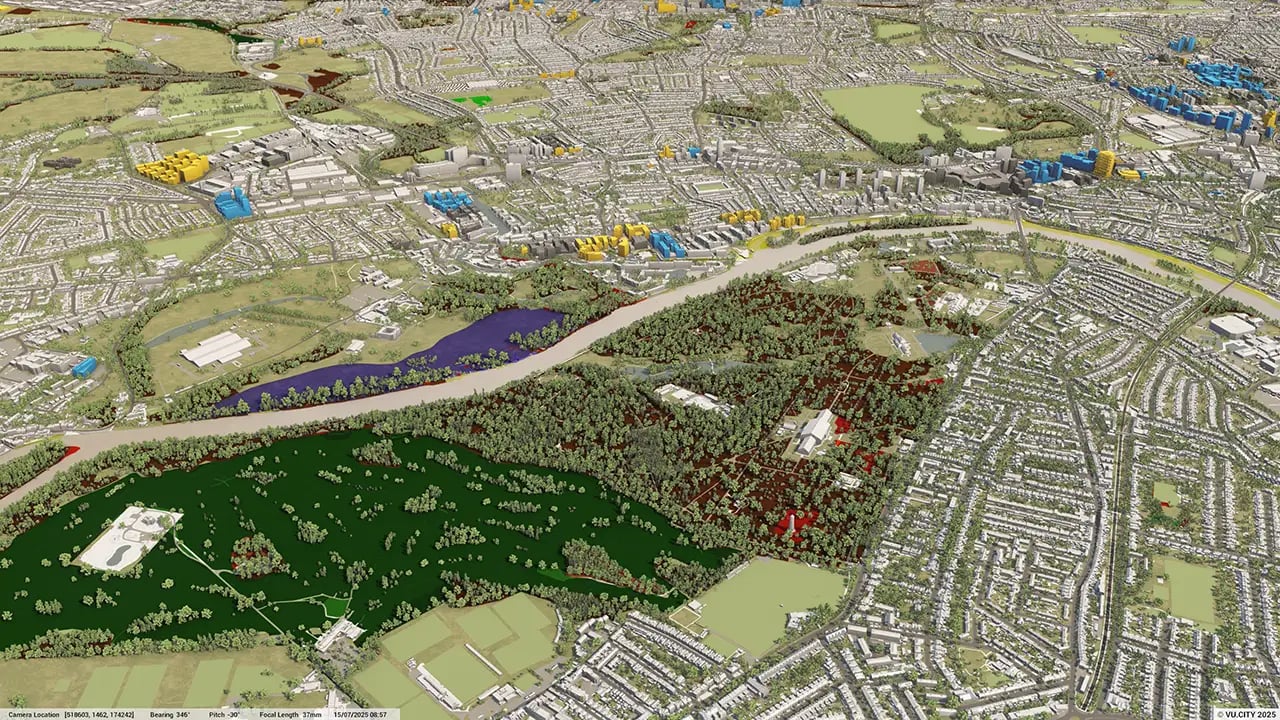
158,823TREES, ACCURATE HEIGHT AND CANOPY

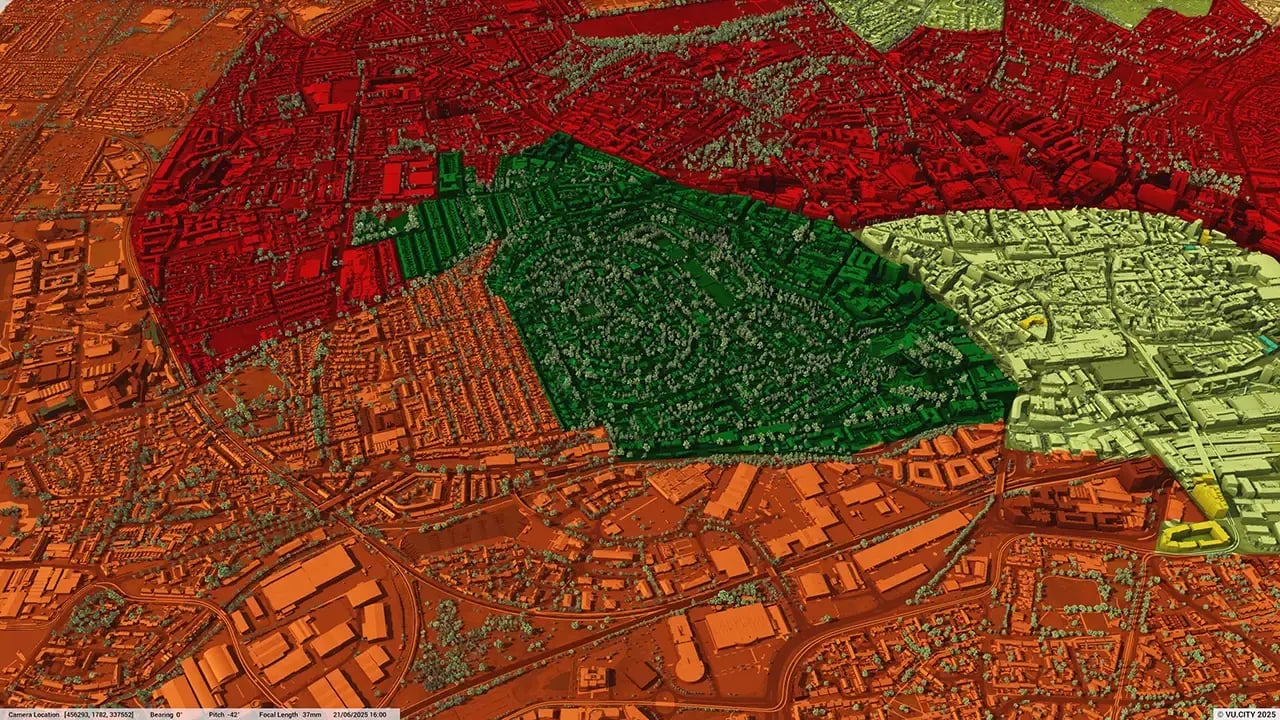
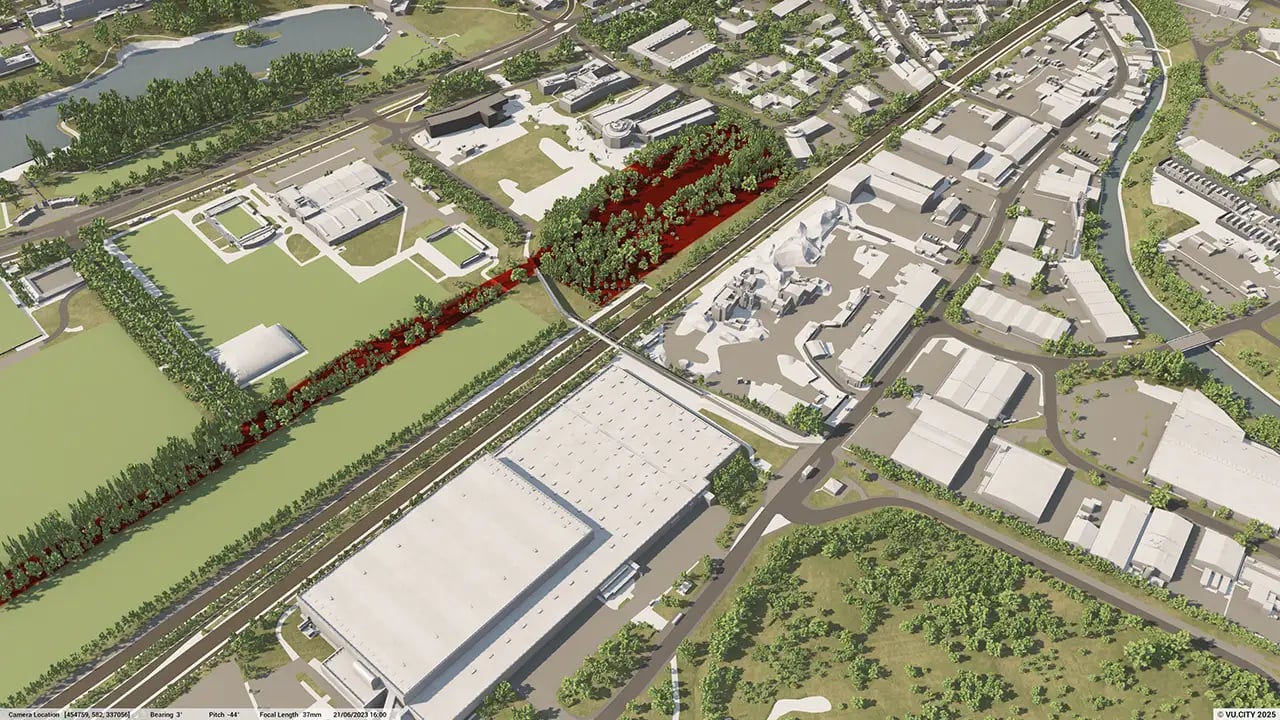
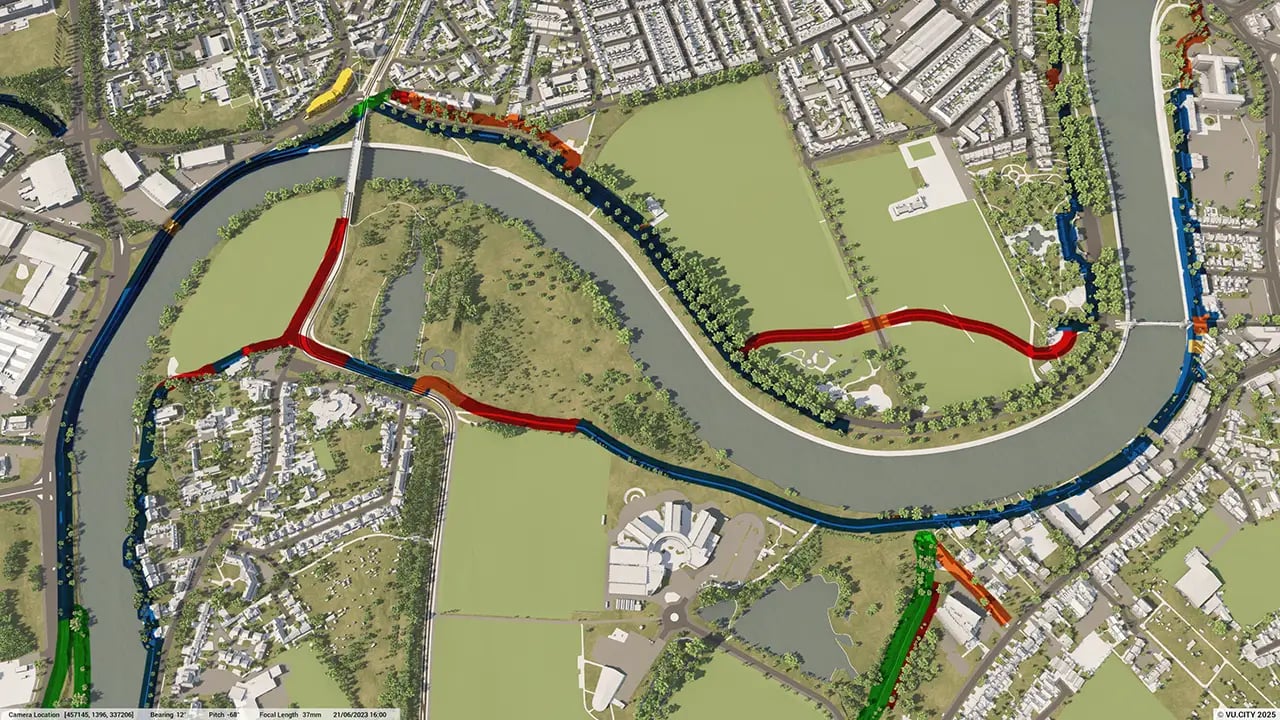
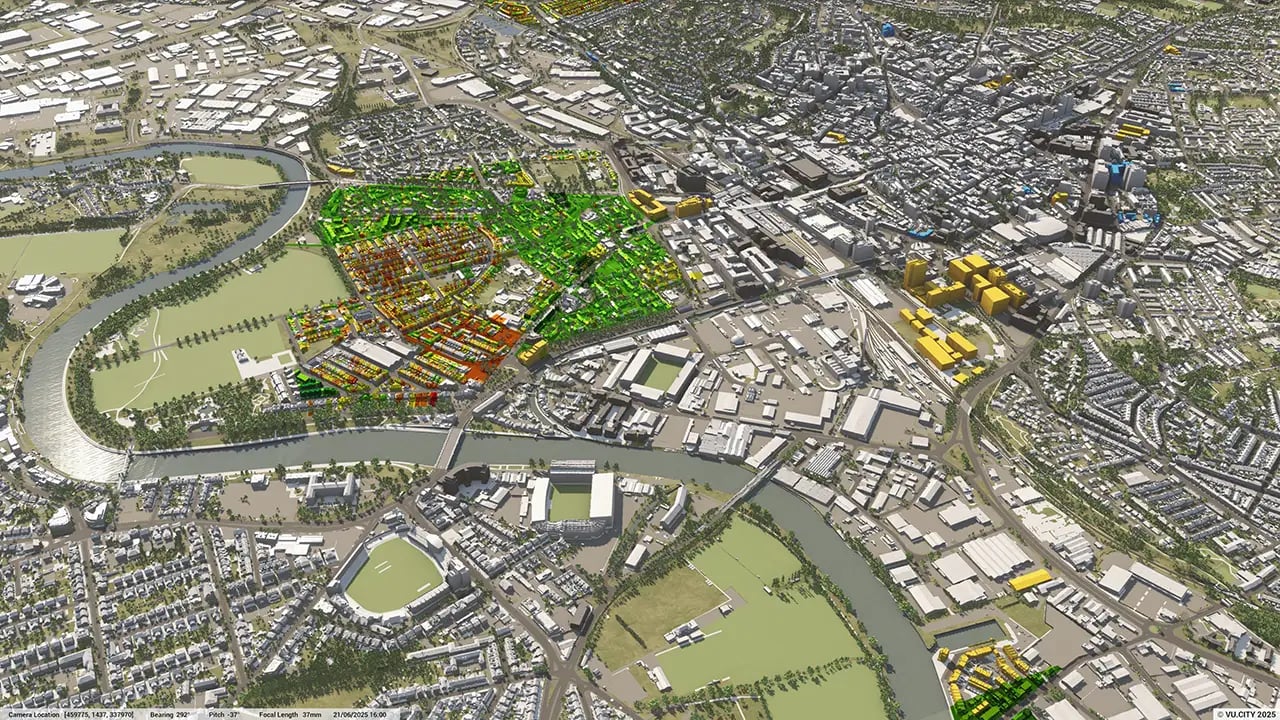
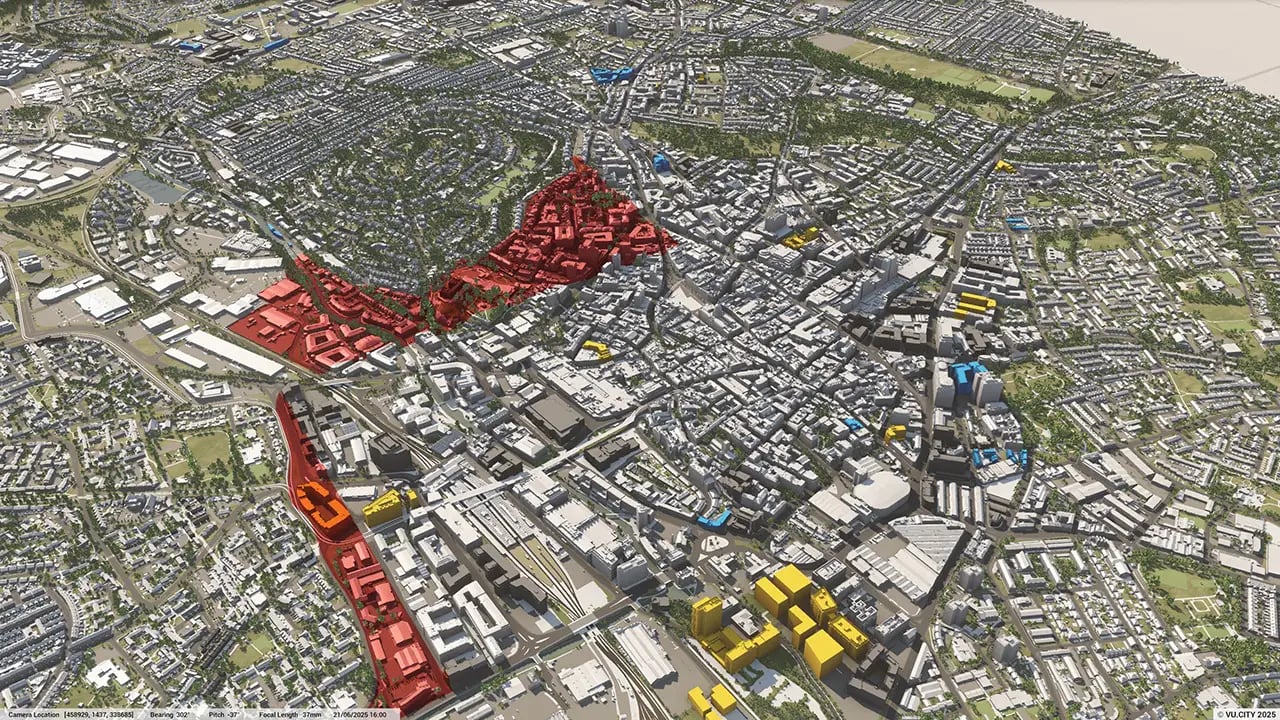
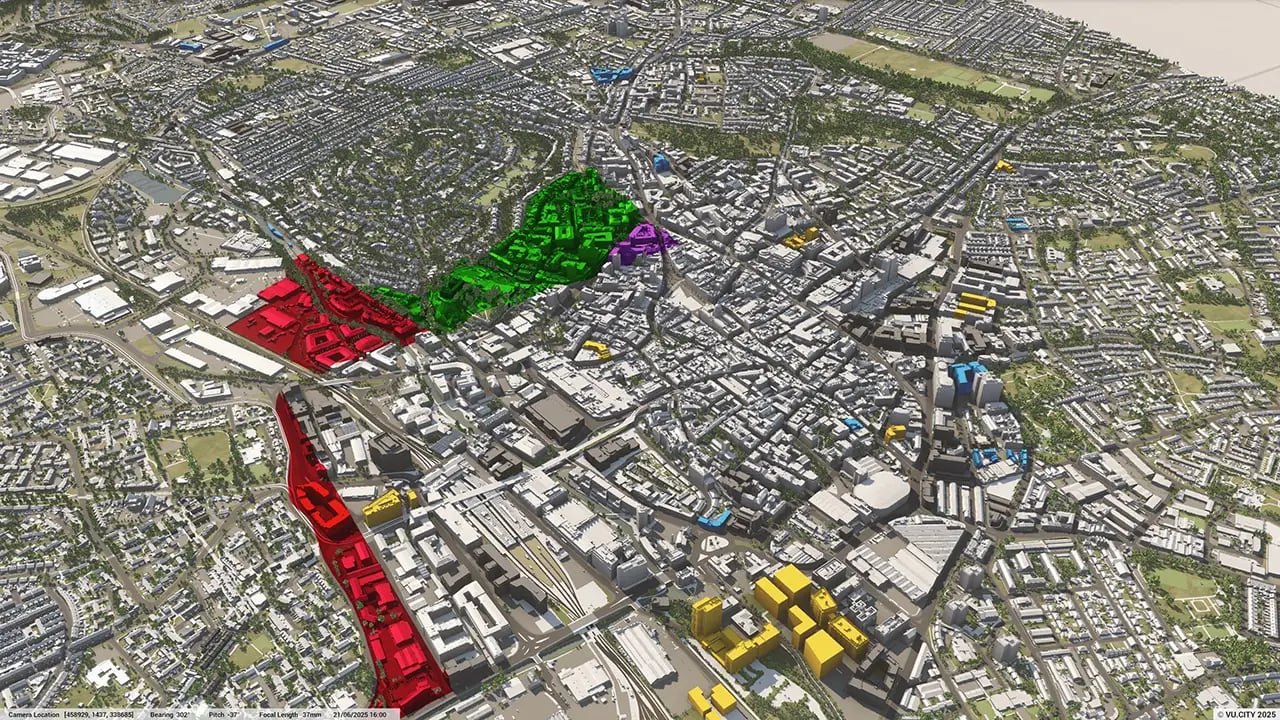
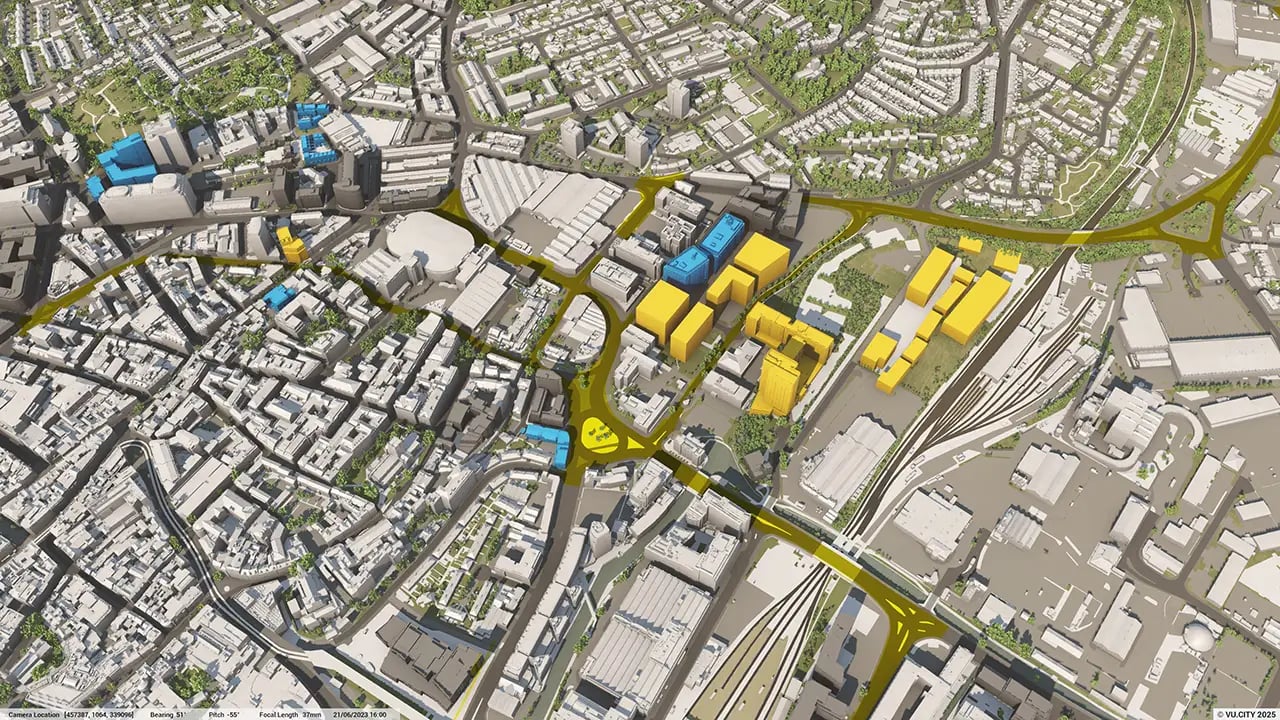
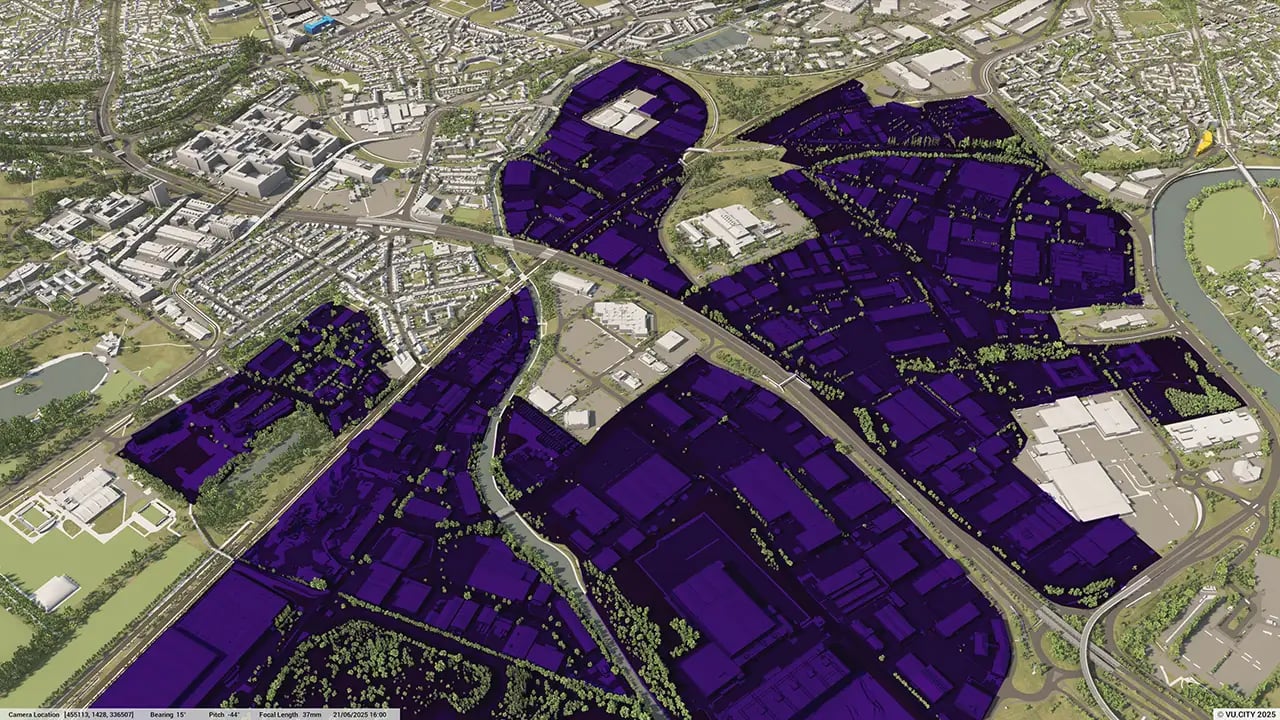
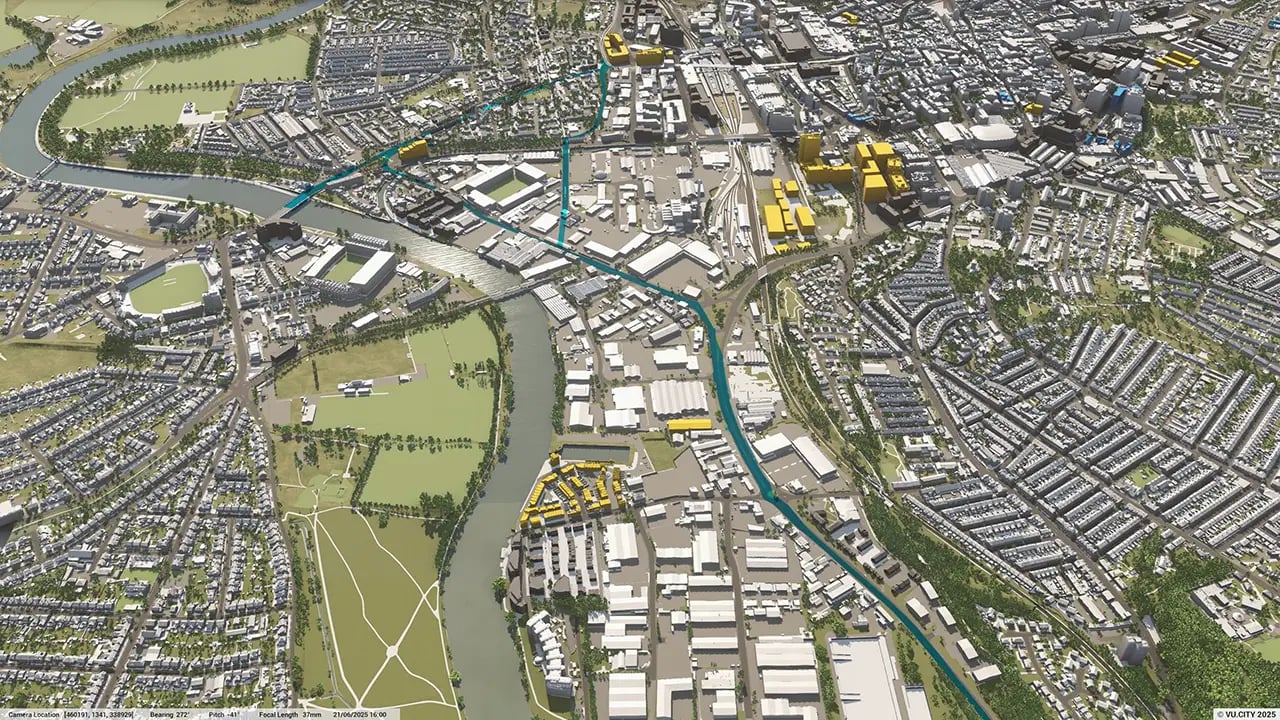
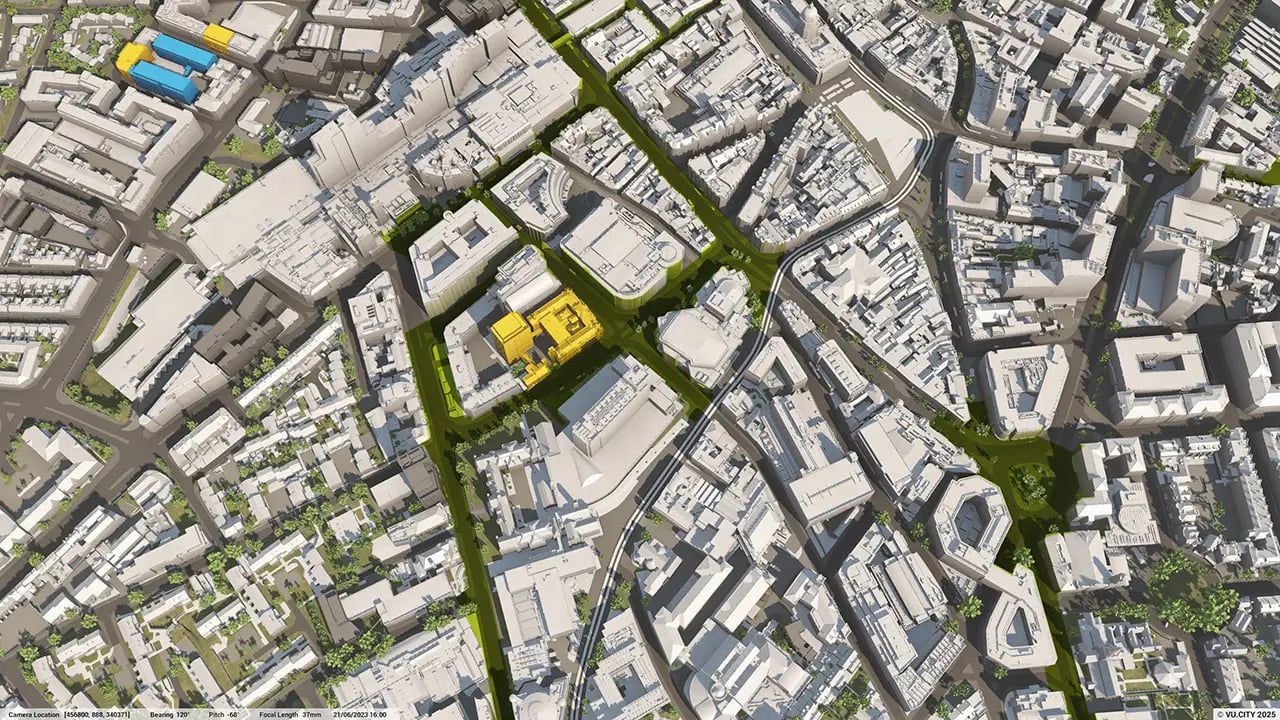
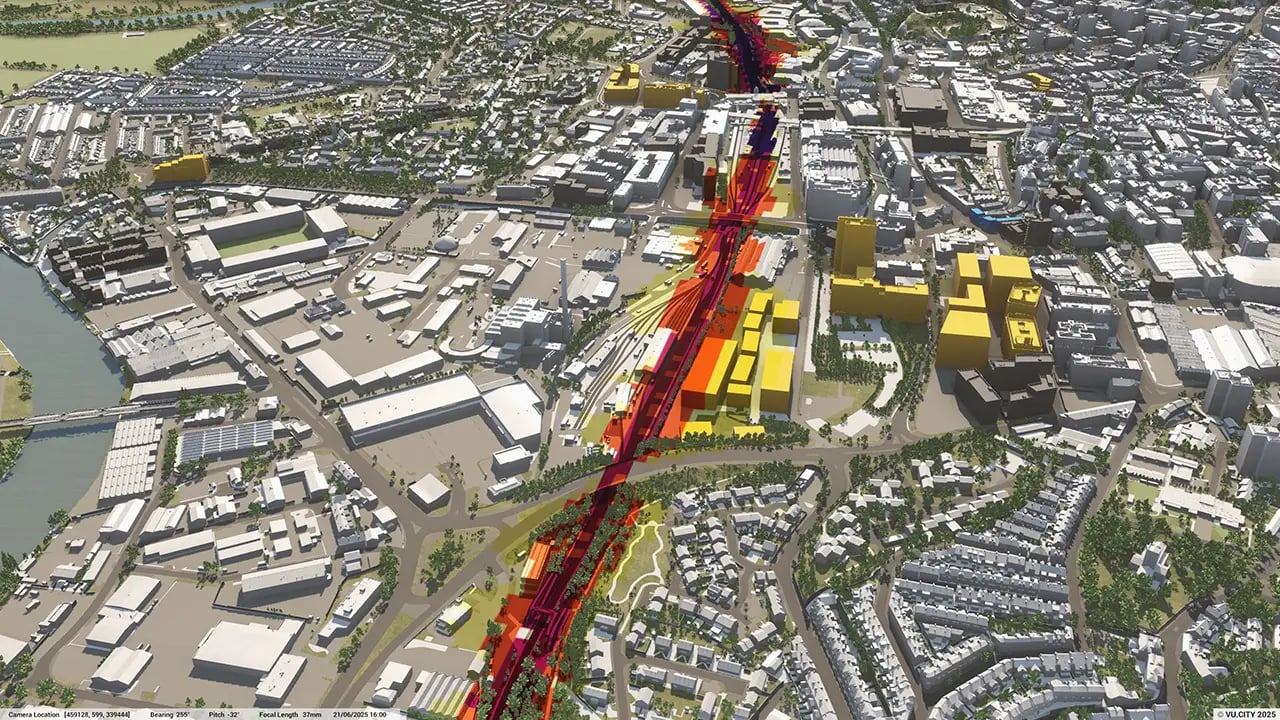
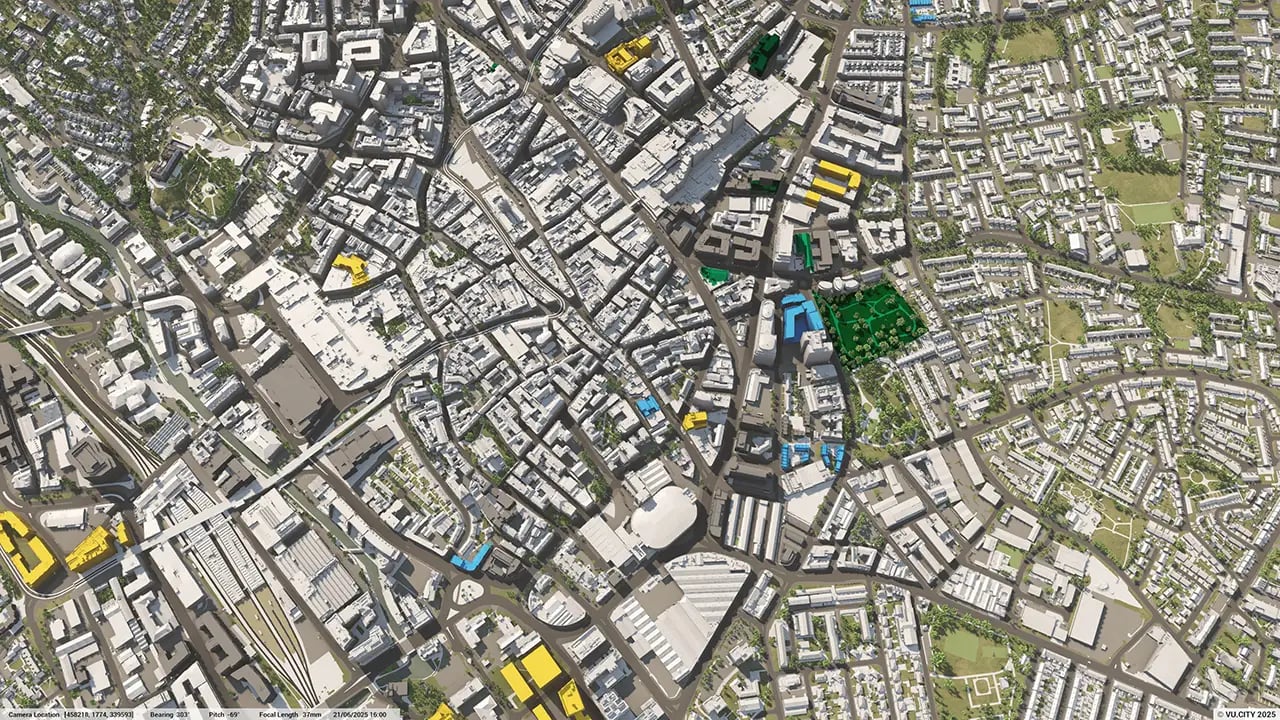
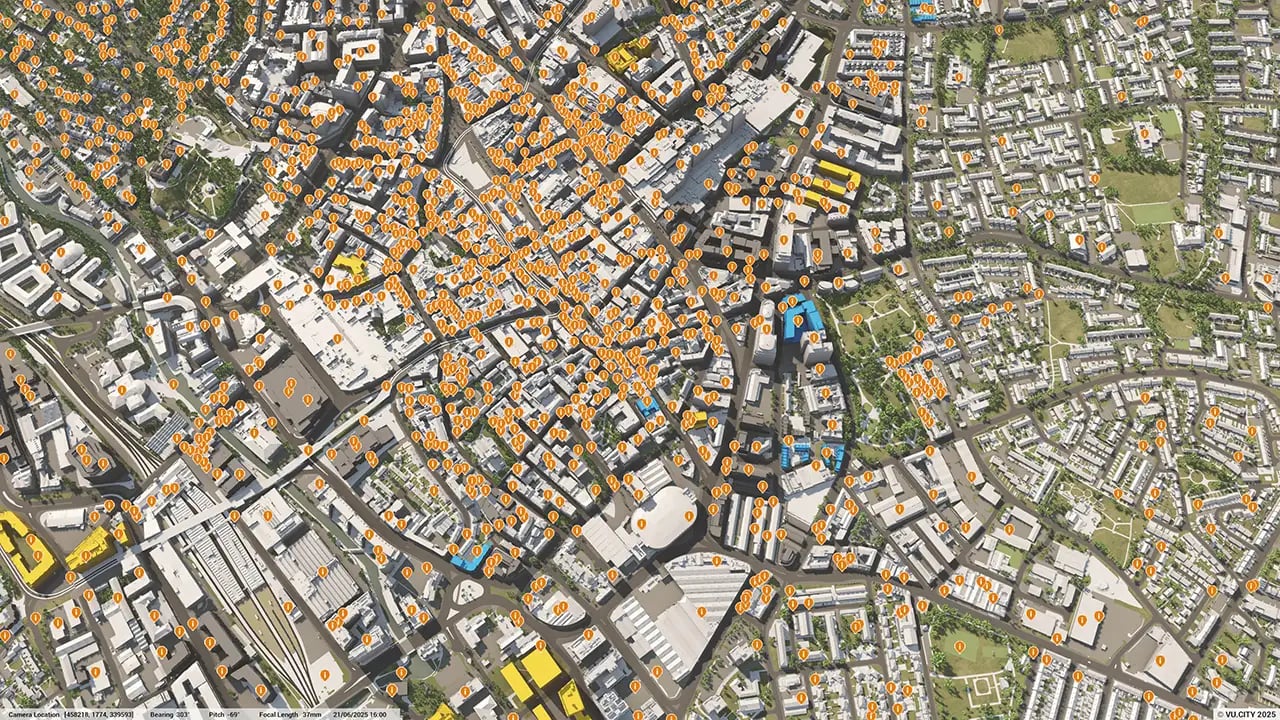
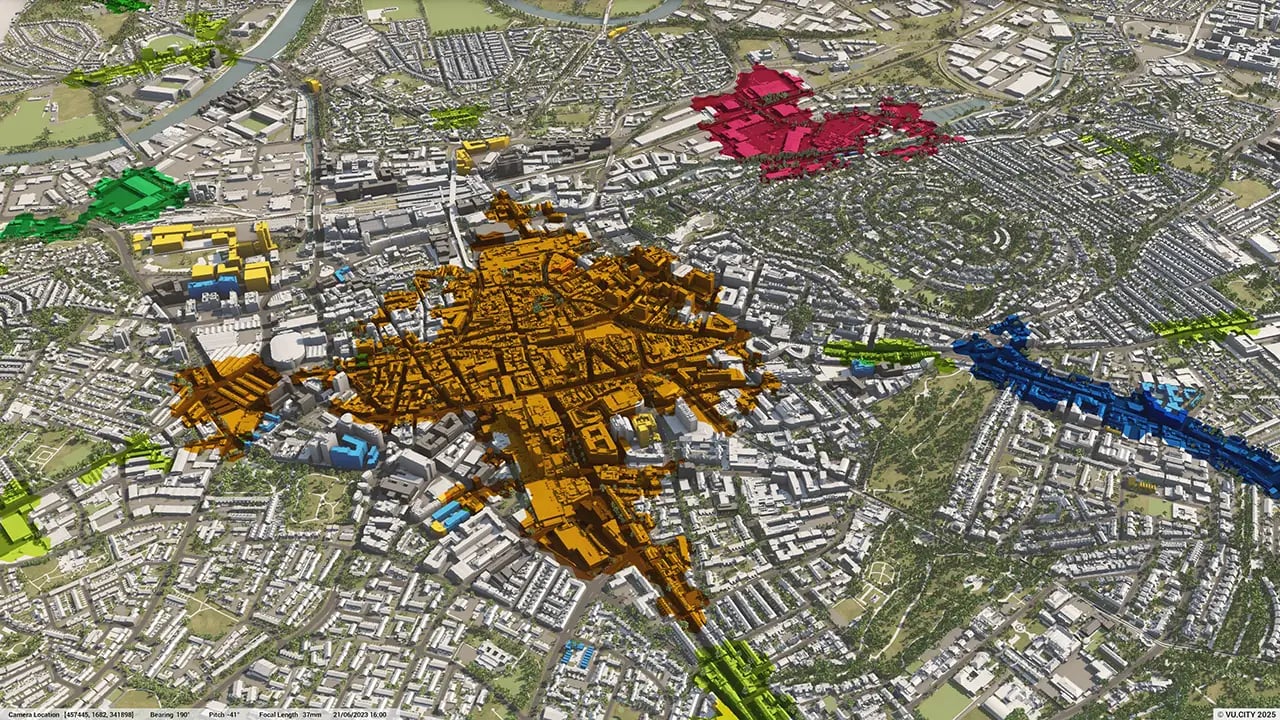
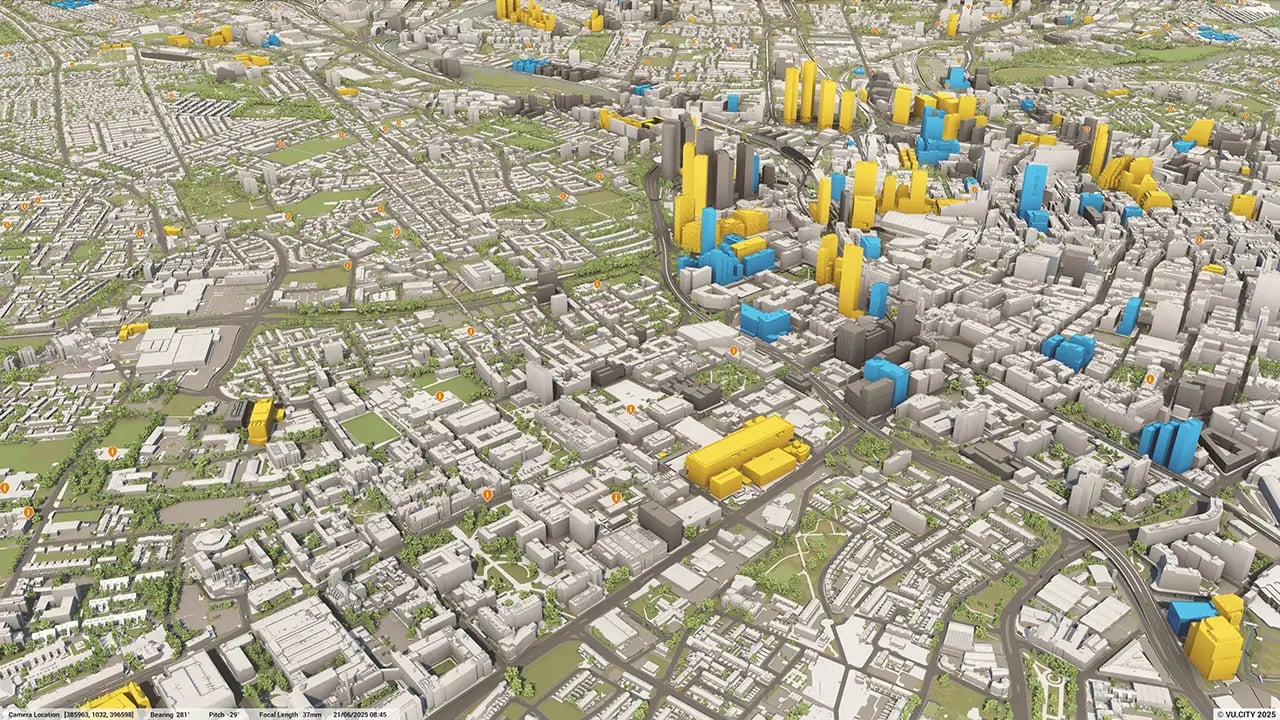
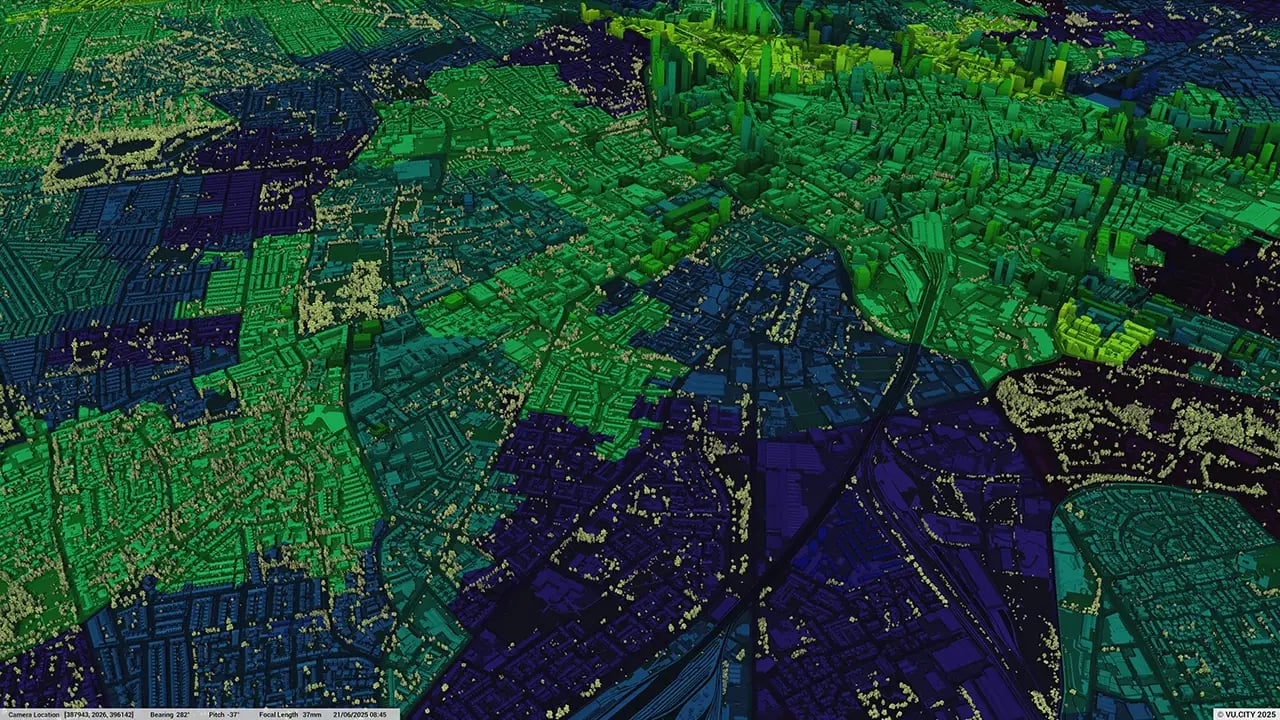
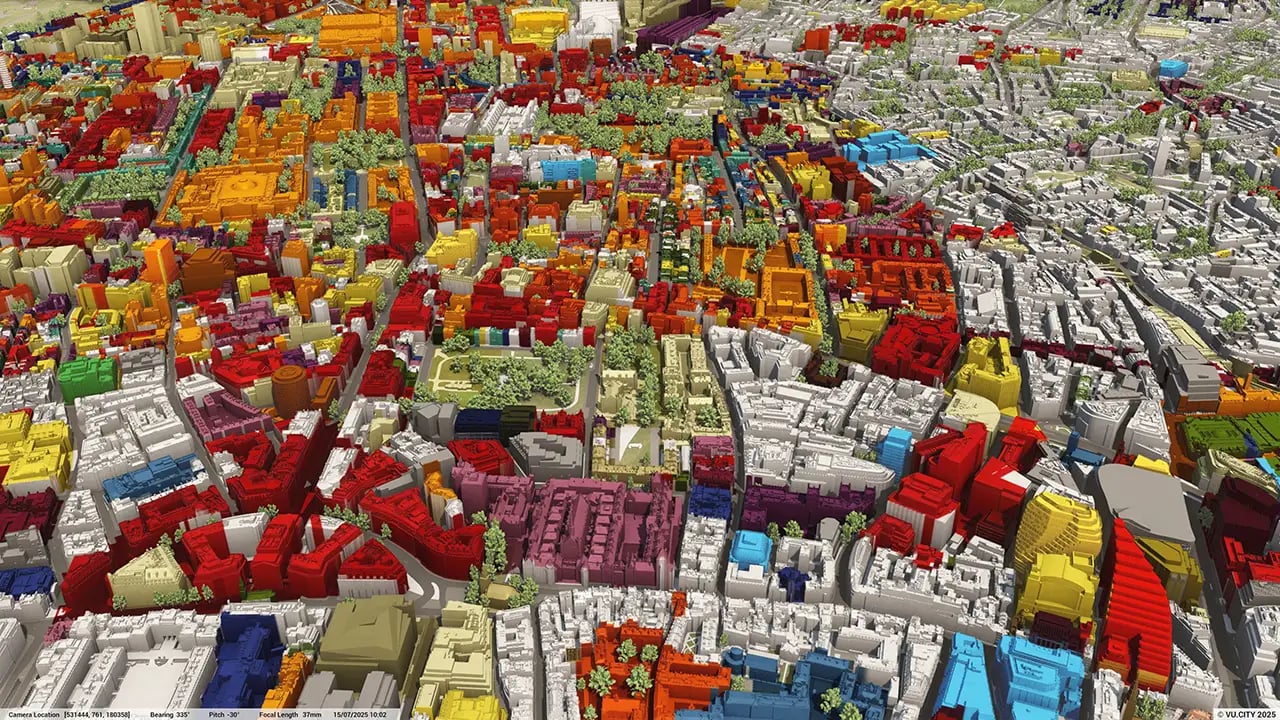
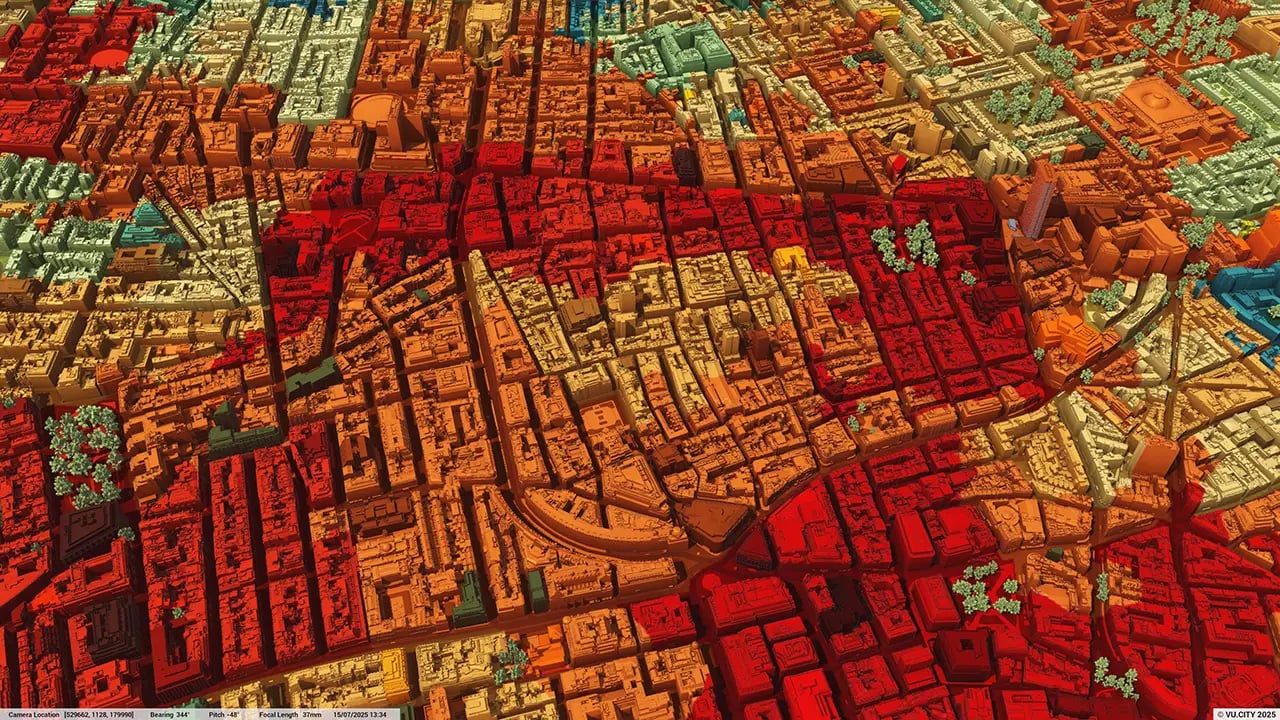
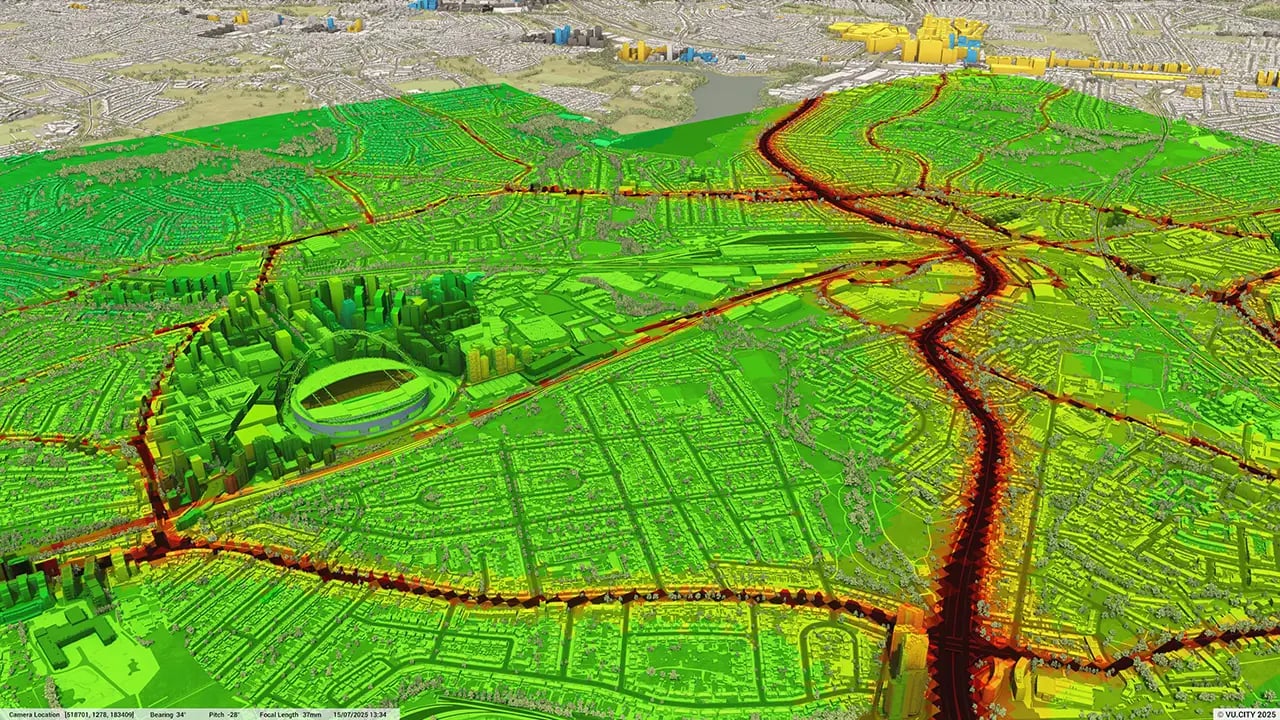
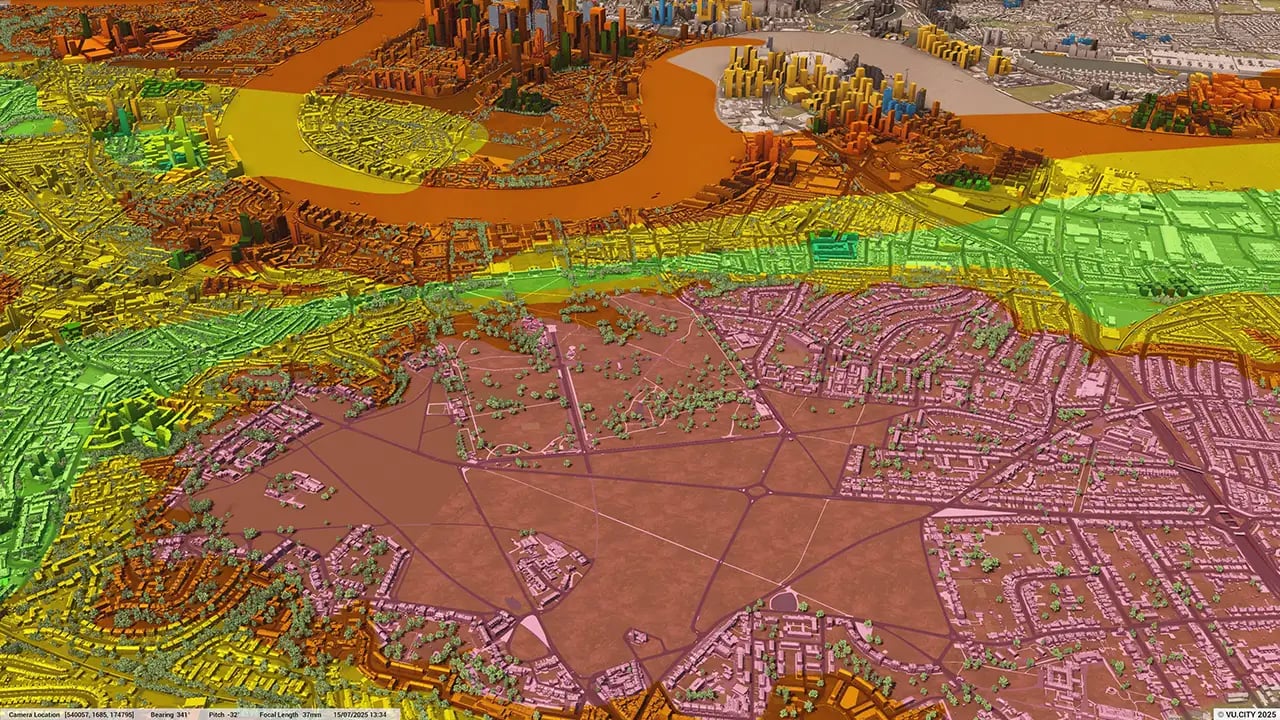
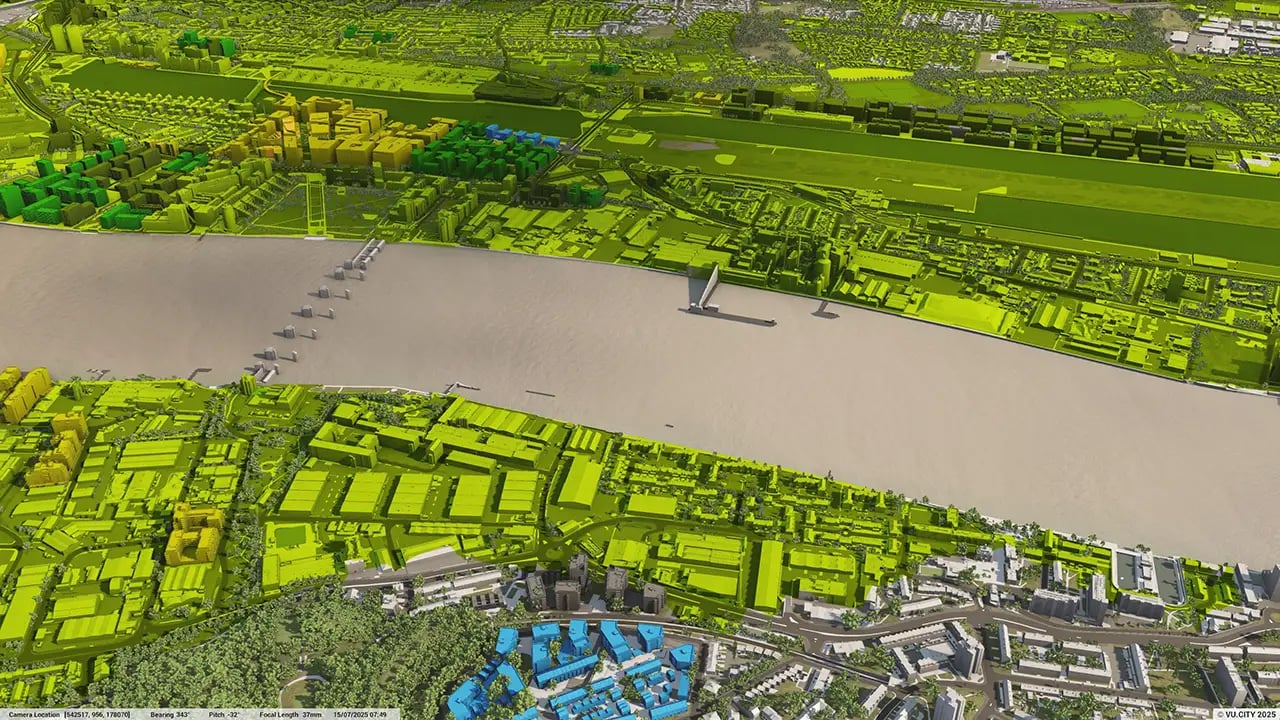
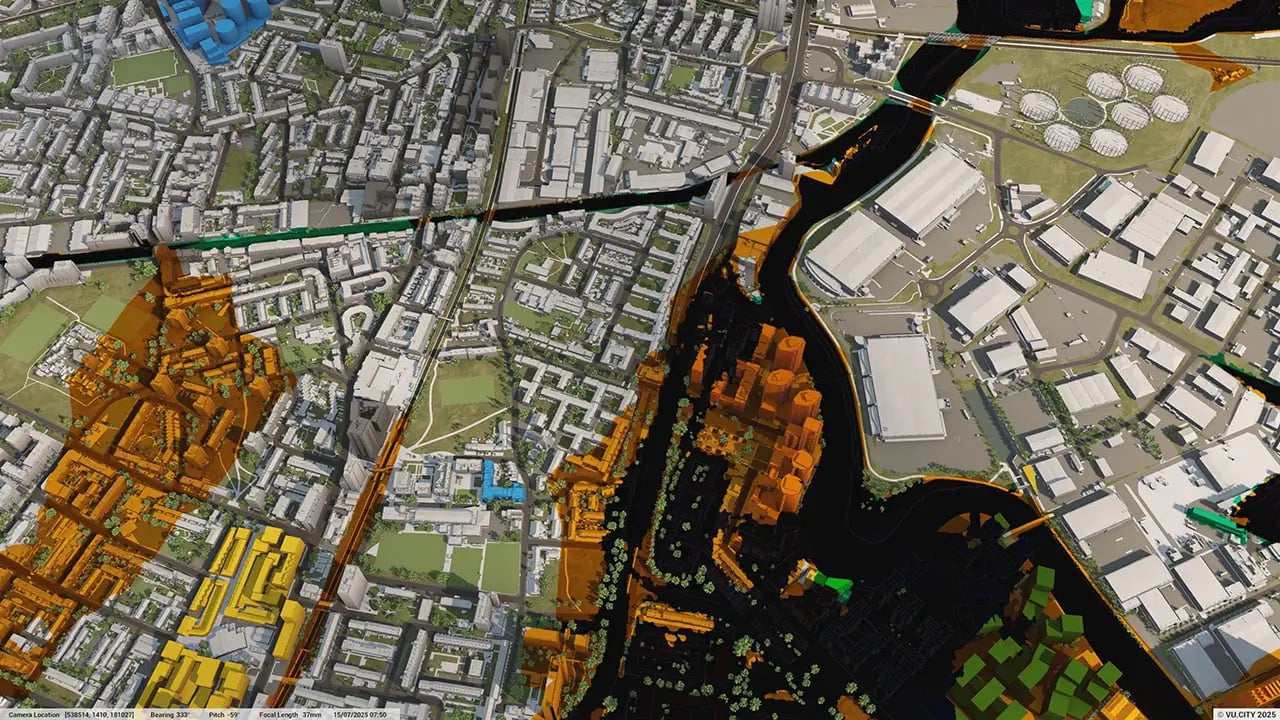
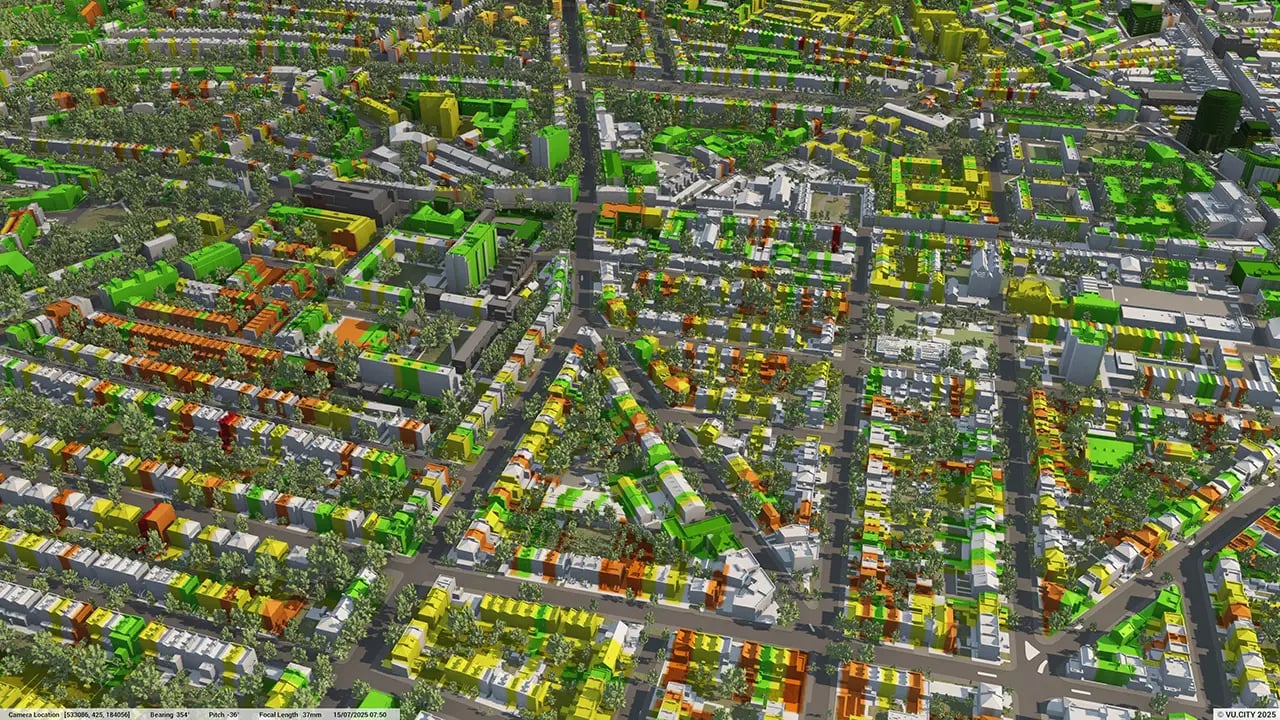
Nottingham data layers
From transportation and zoning to environmental factors, the data layers in VU.CITY’s Nottingham 3D model provide essential insights for more informed and confident decision-making.
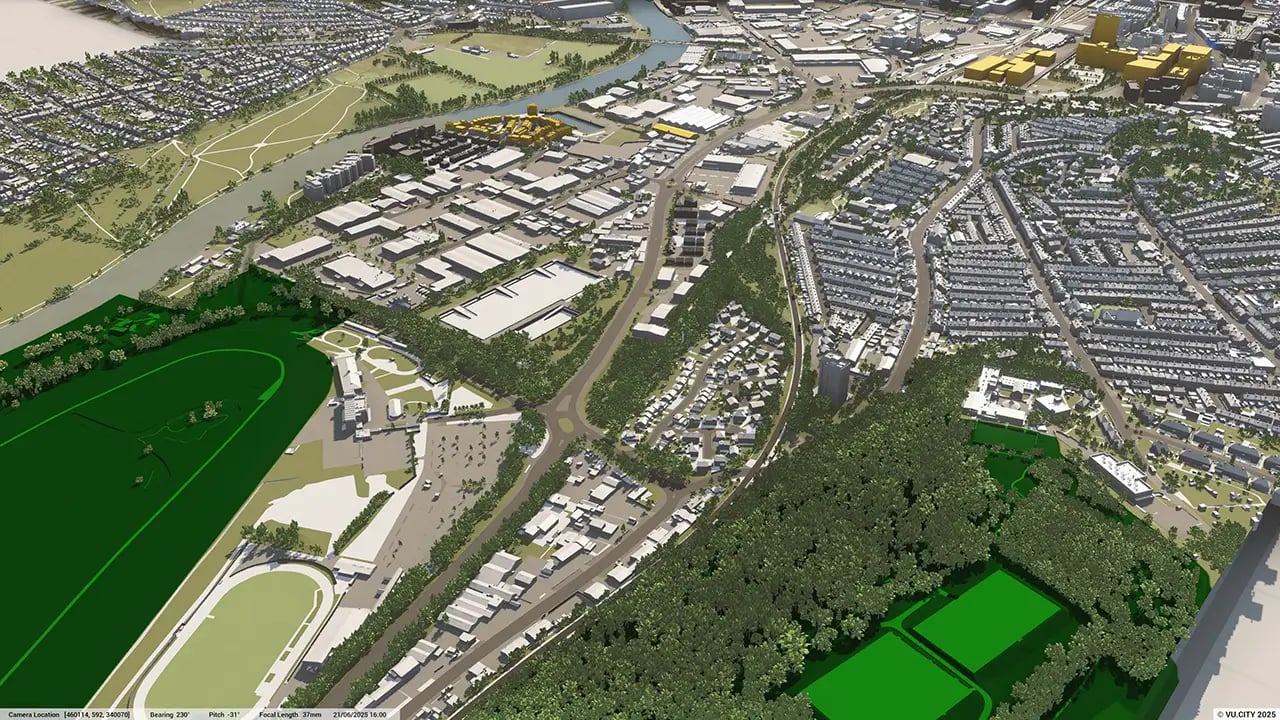
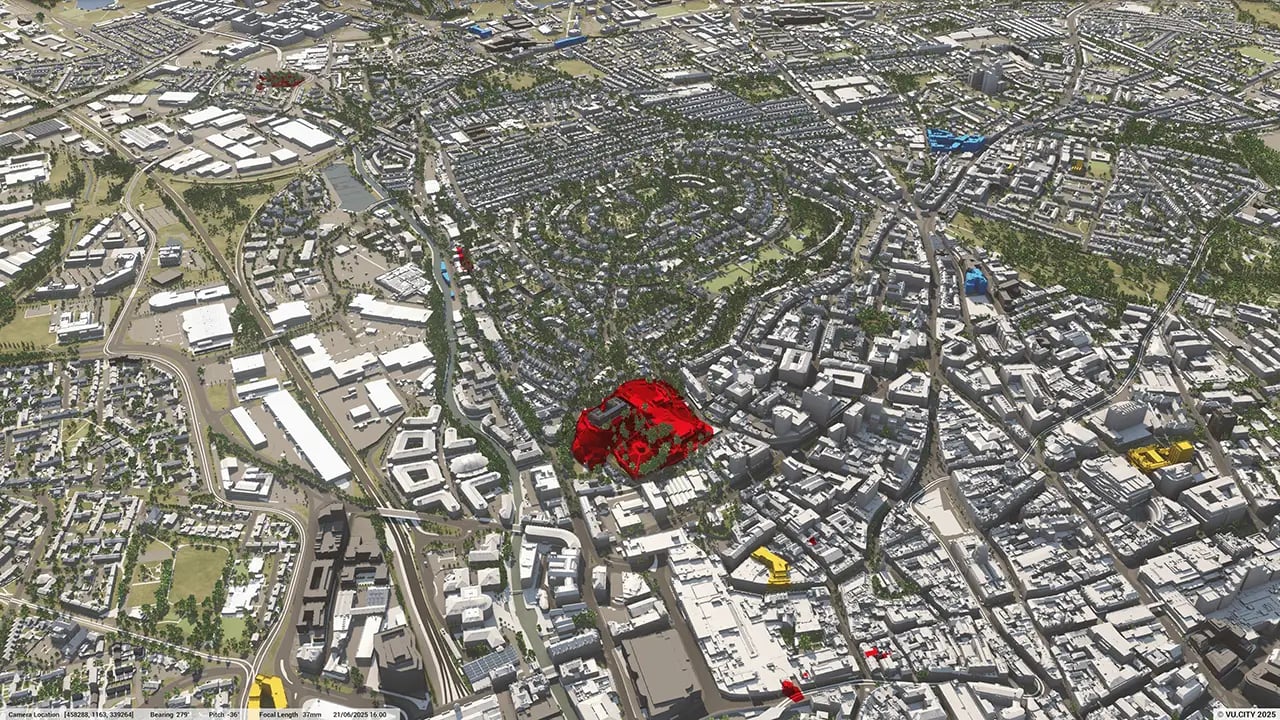
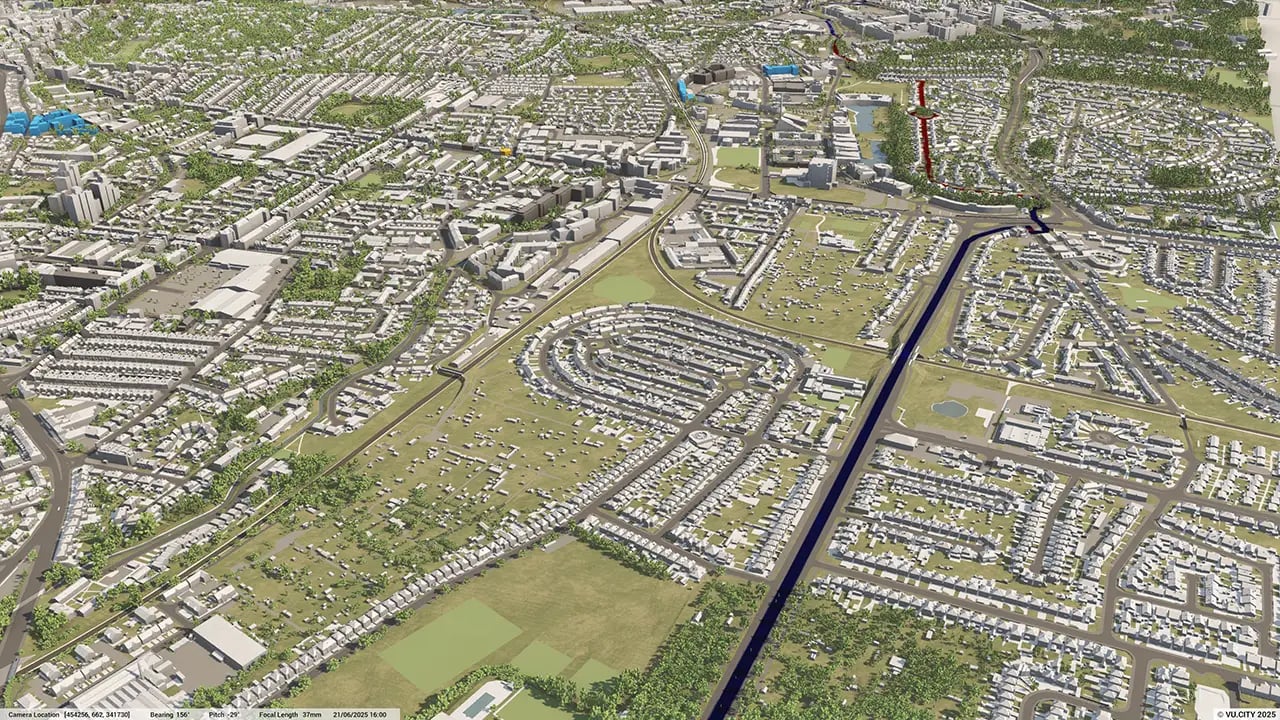

Nottingham lies at the heart of the East Midlands and is a major metropolitan city and transport hub: a place with a legendary past and a vibrant culture.
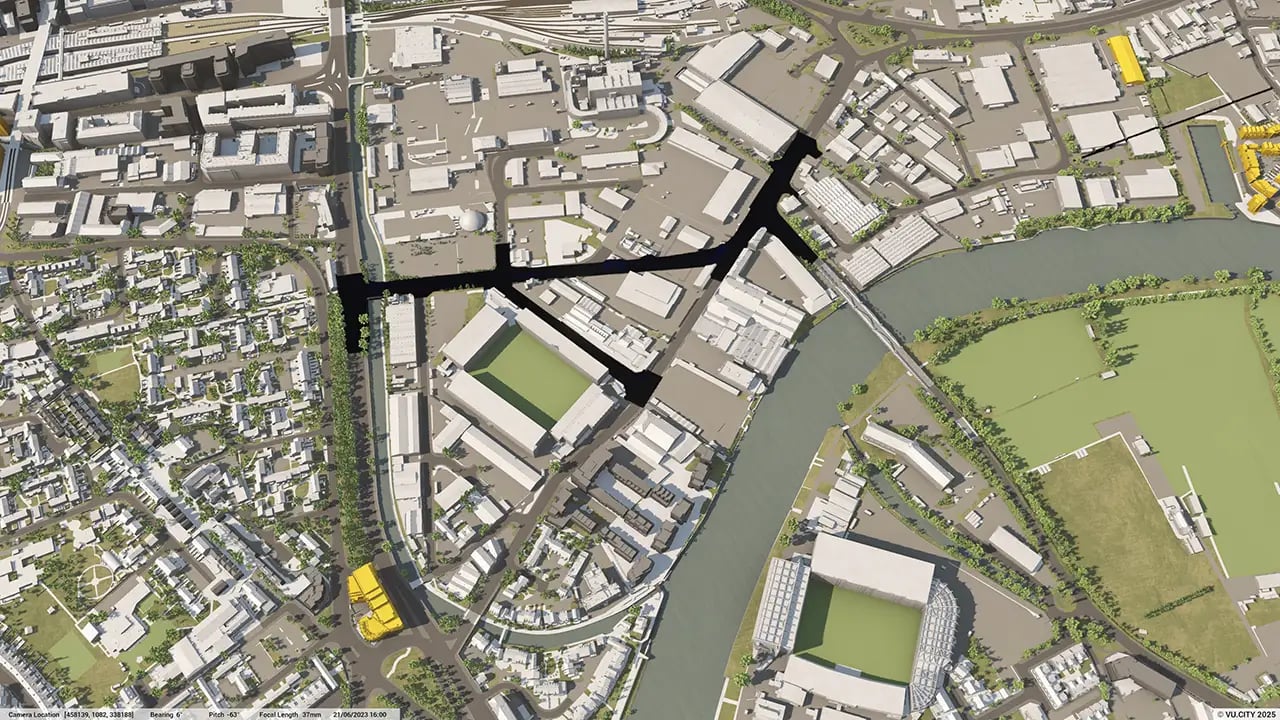
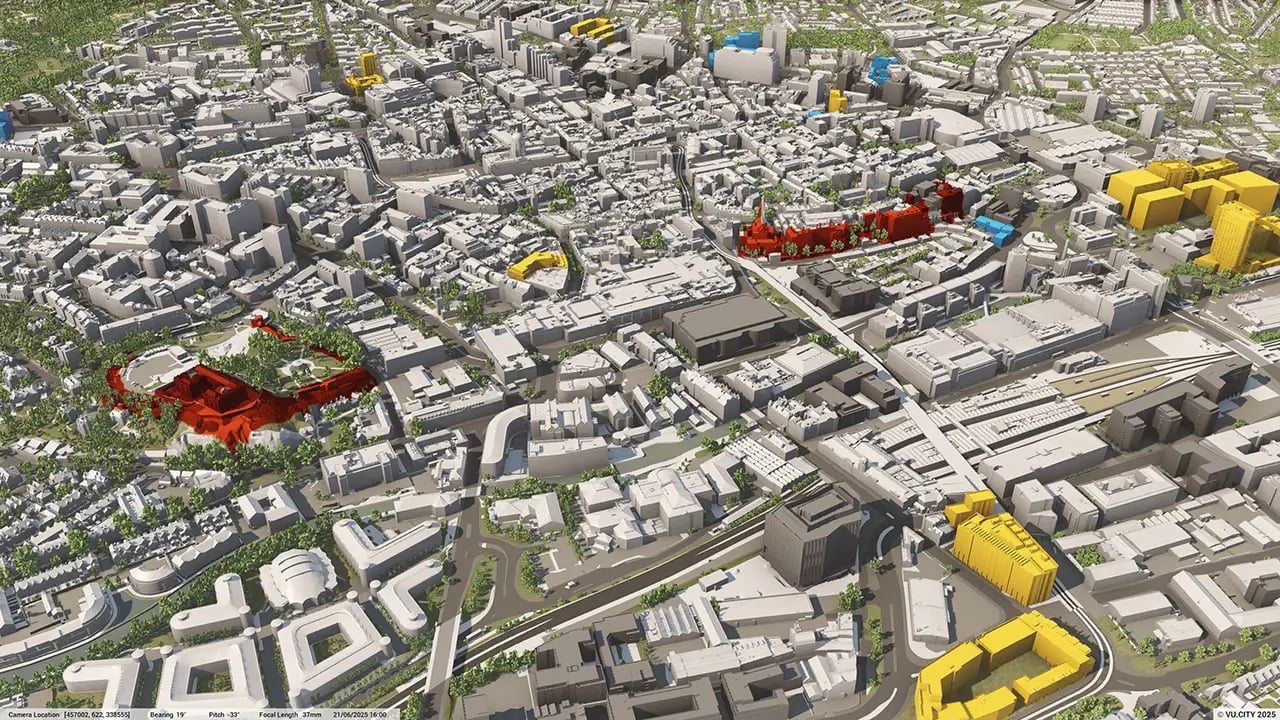
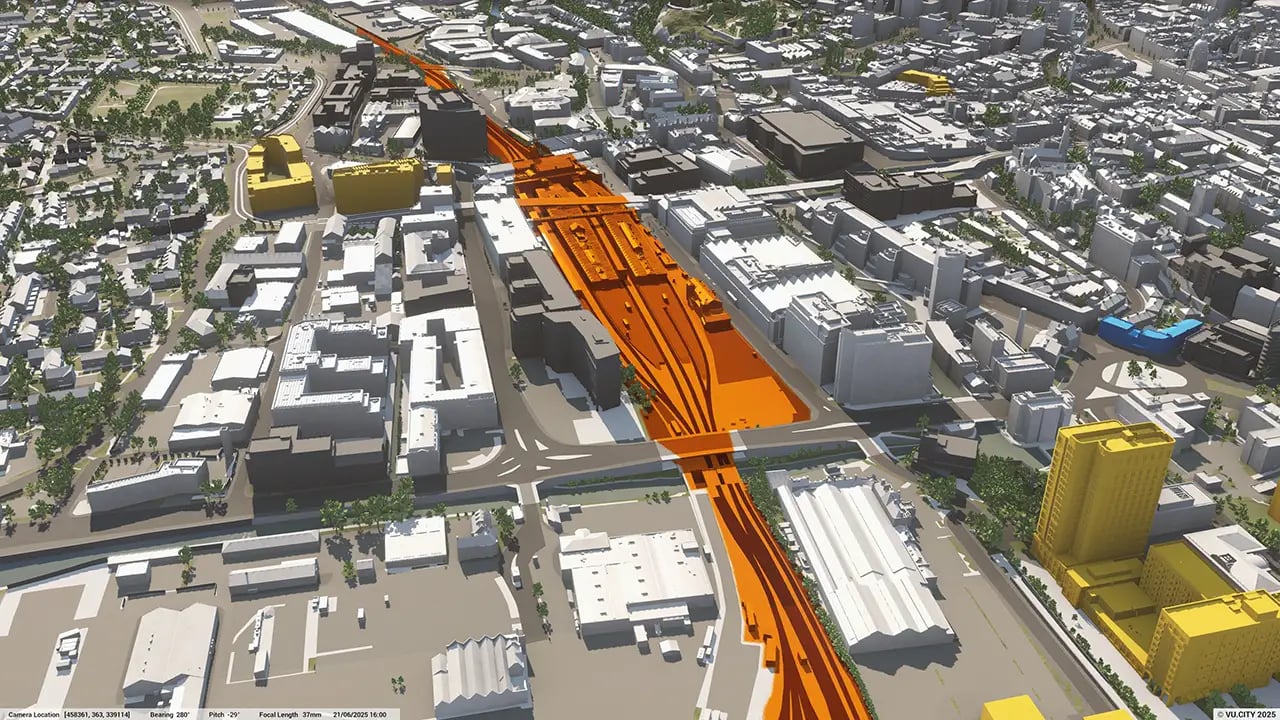
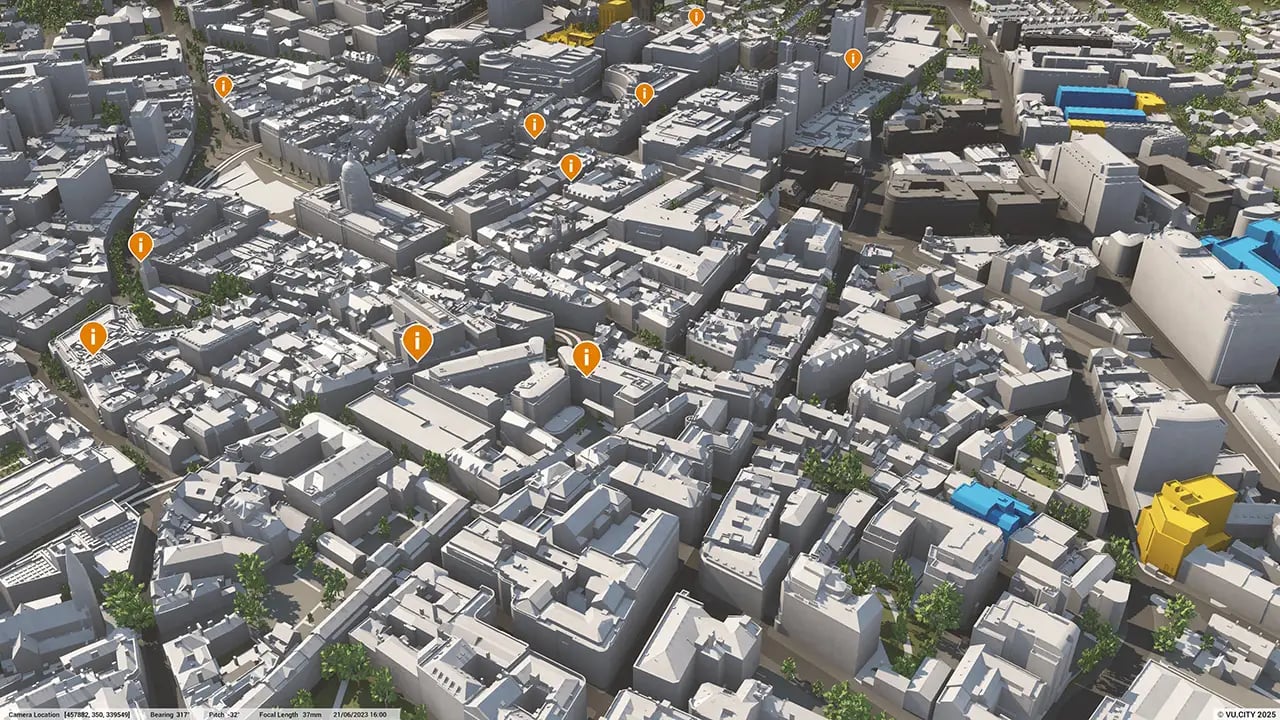
Several major projects are already underway: digitising planning and development is key in saving time and costs for all to ensure progress is smooth. The recent and ongoing major redevelopment of the whole Broadmarsh shopping centre will drastically improve the city centre once completed, with a new Broadmarsh car park and bus station, central library, Nottingham Castle visitor experience, Nottingham College City Hub and reimagined public realm. The Broadmarsh car park and bus station is already changing the city centre for the better and is a marked improvement to what was there previously, with retail outlets also under development on Carrington Street.
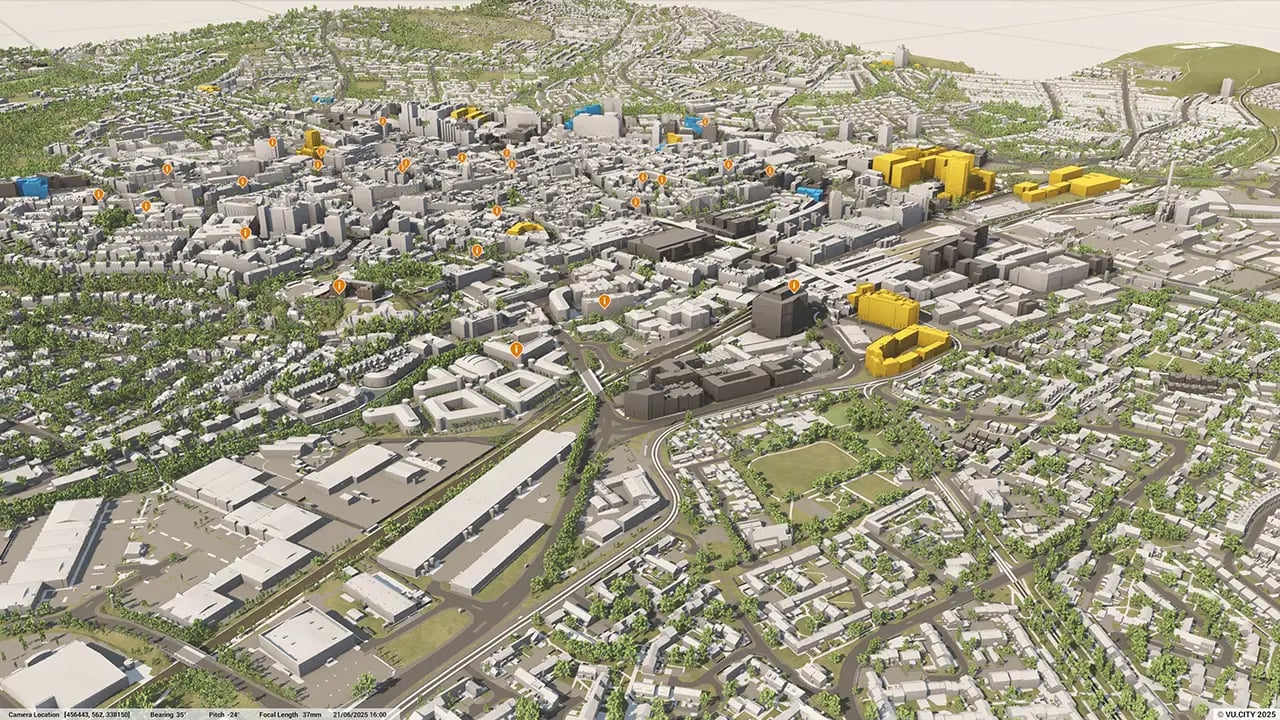
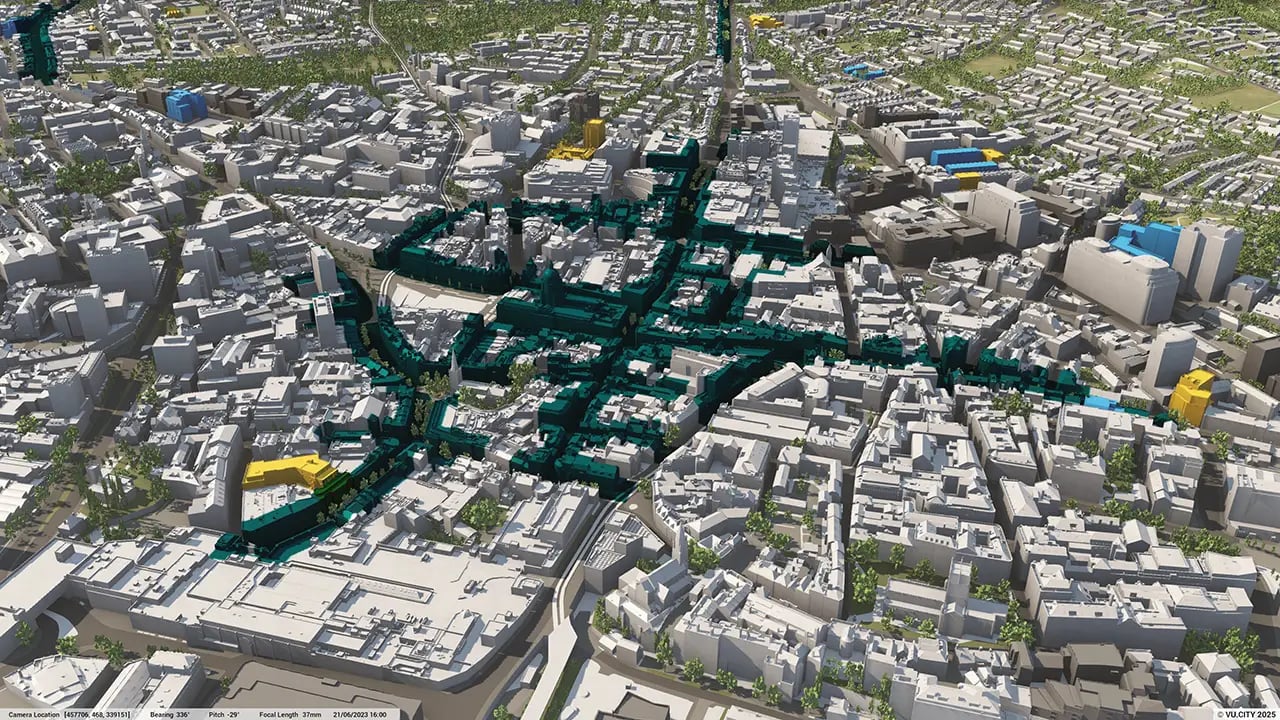
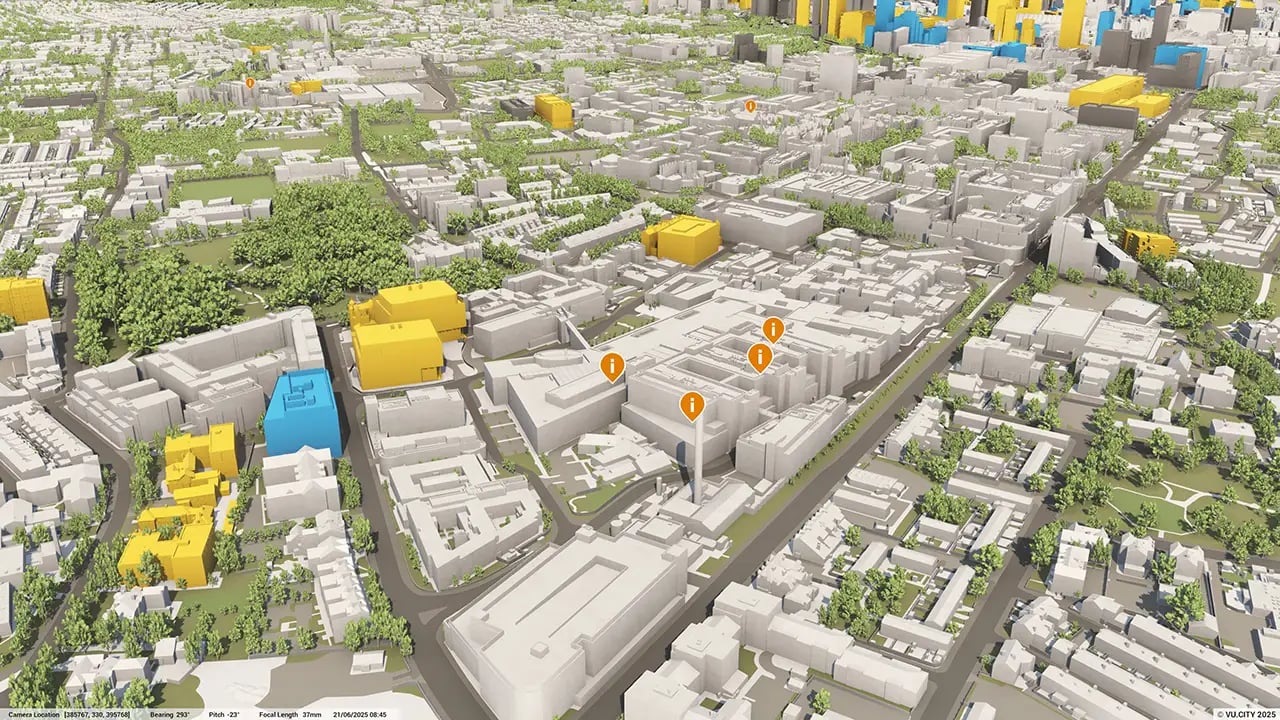
As Nottingham city centre is redeveloped, and as the city grows to meet housing and transport needs, the need for an open and transparent platform to visualise these changes will be imperative. VU.CITY, accurate to within 15 cm, can enable all stakeholders to understand how to improve the public realm, highlighting areas for improvement through updated data layers and assessing the implications and visual impact of a design or proposal visual in order to respect Nottingham’s buildings of special architectural and historic interest.
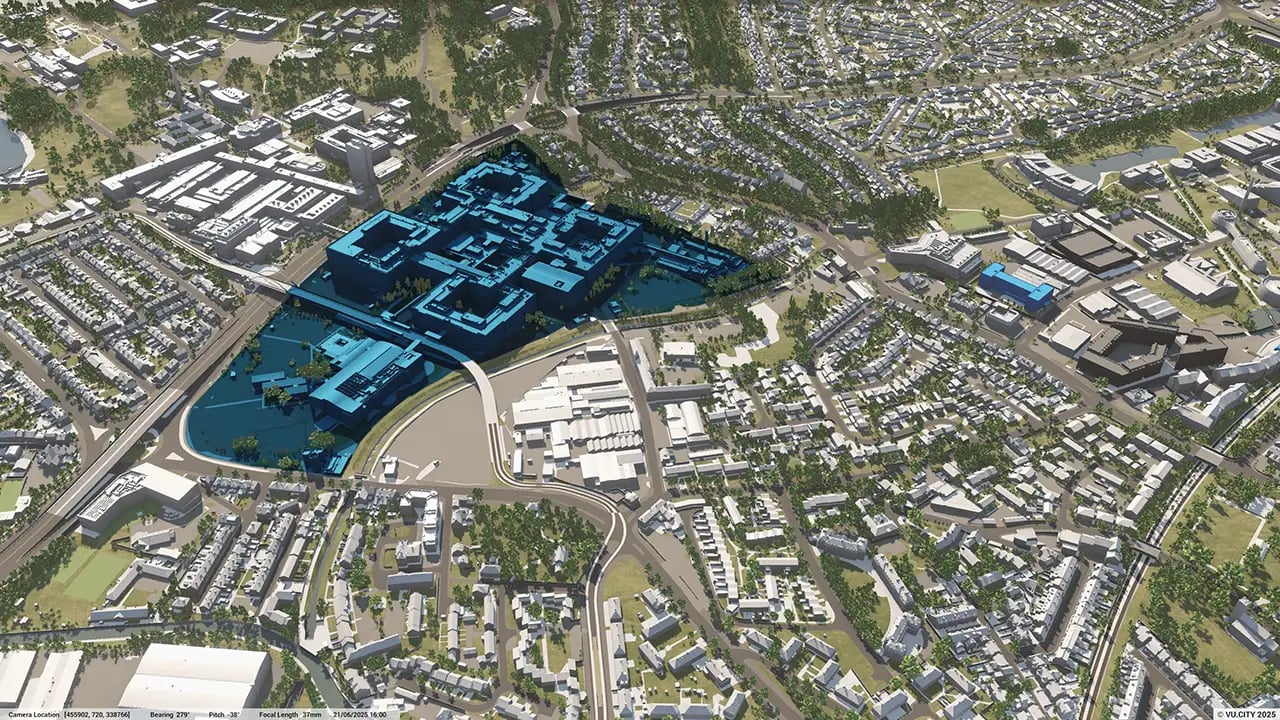
Nottingham Council, leading architects, developers and planning consultants are using VU.CITY Nottingham to help them make better decisions, faster. From being able to understand and assess a site’s opportunities and challenges, testing refined designs in context, enhancing pre-app conversations and planning submissions, to improving how everyone involved collaborates.
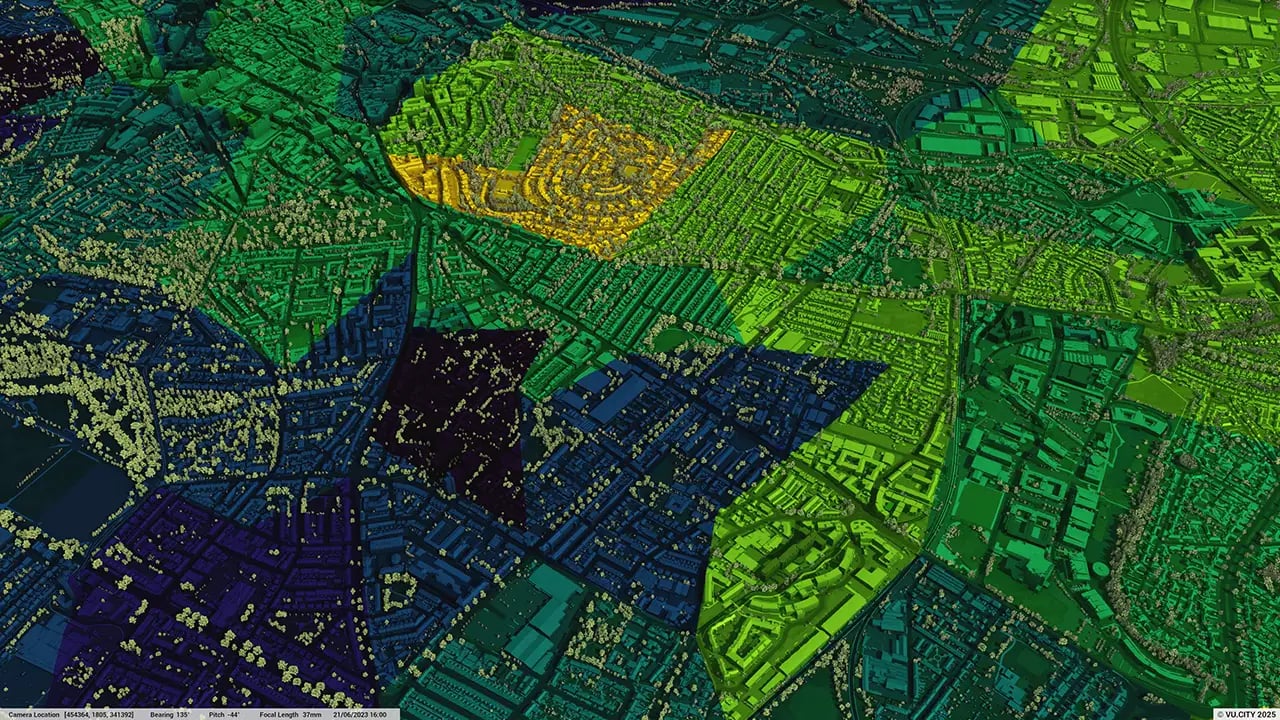
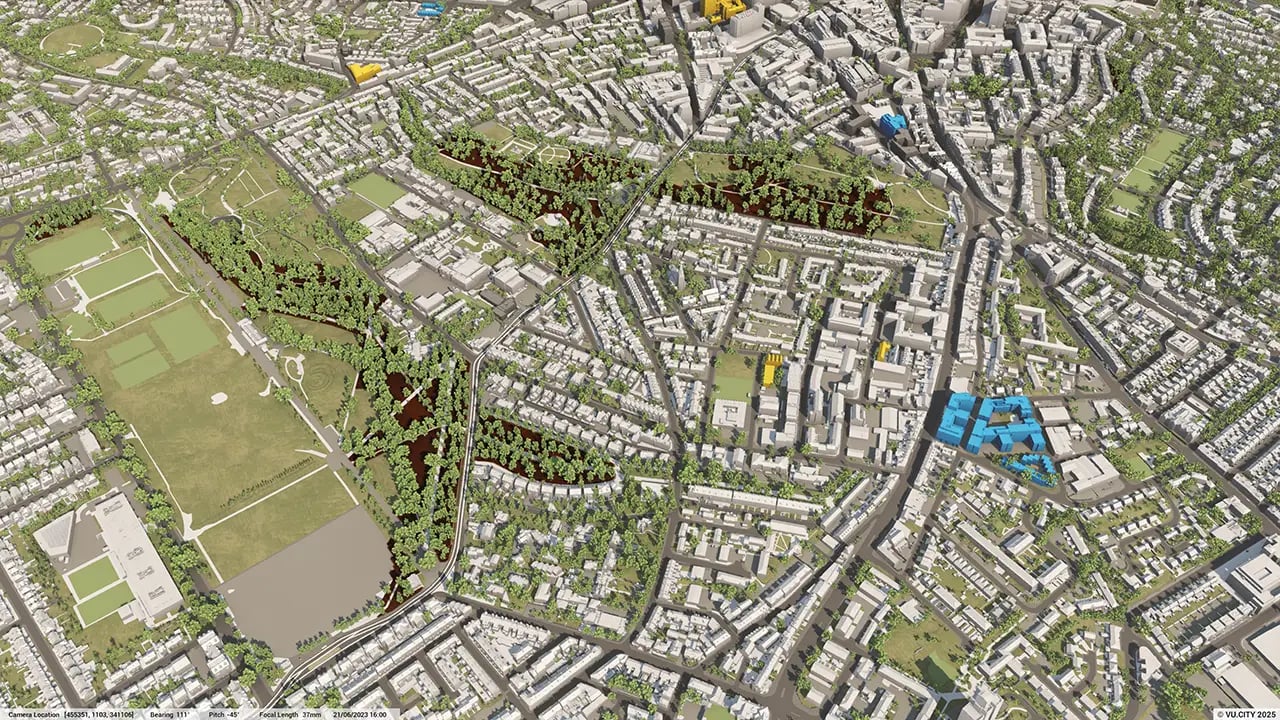
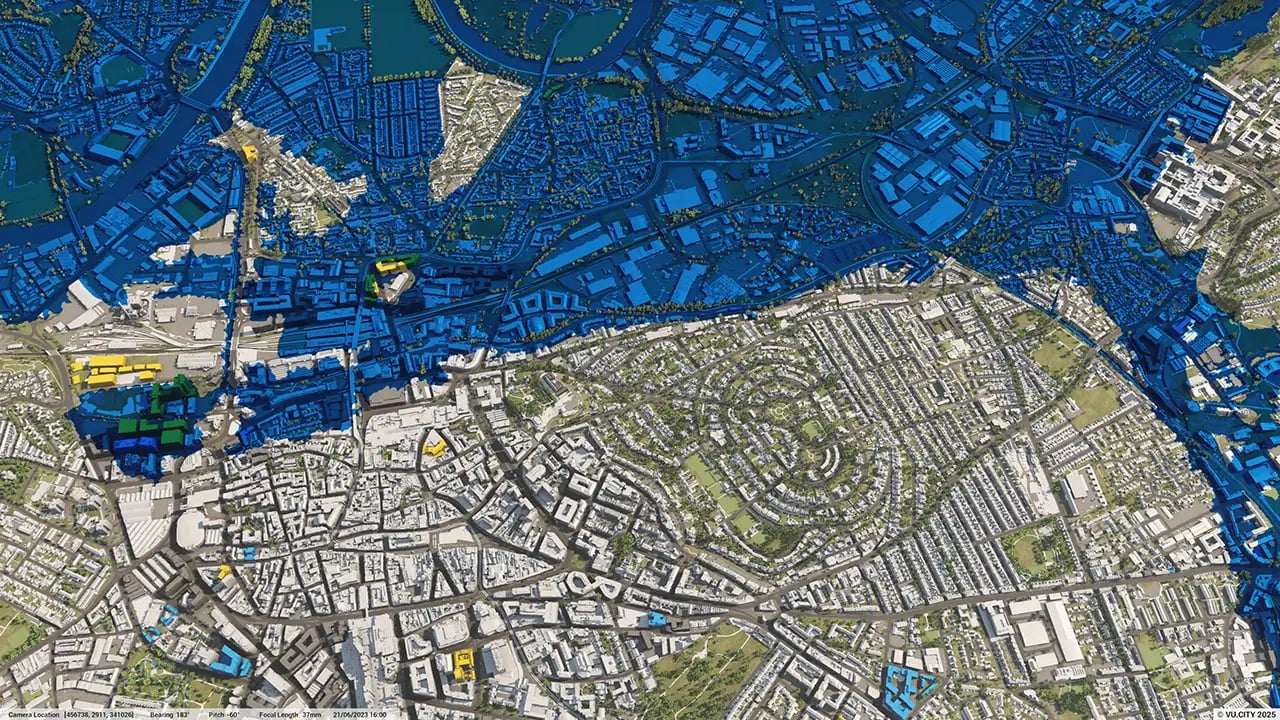
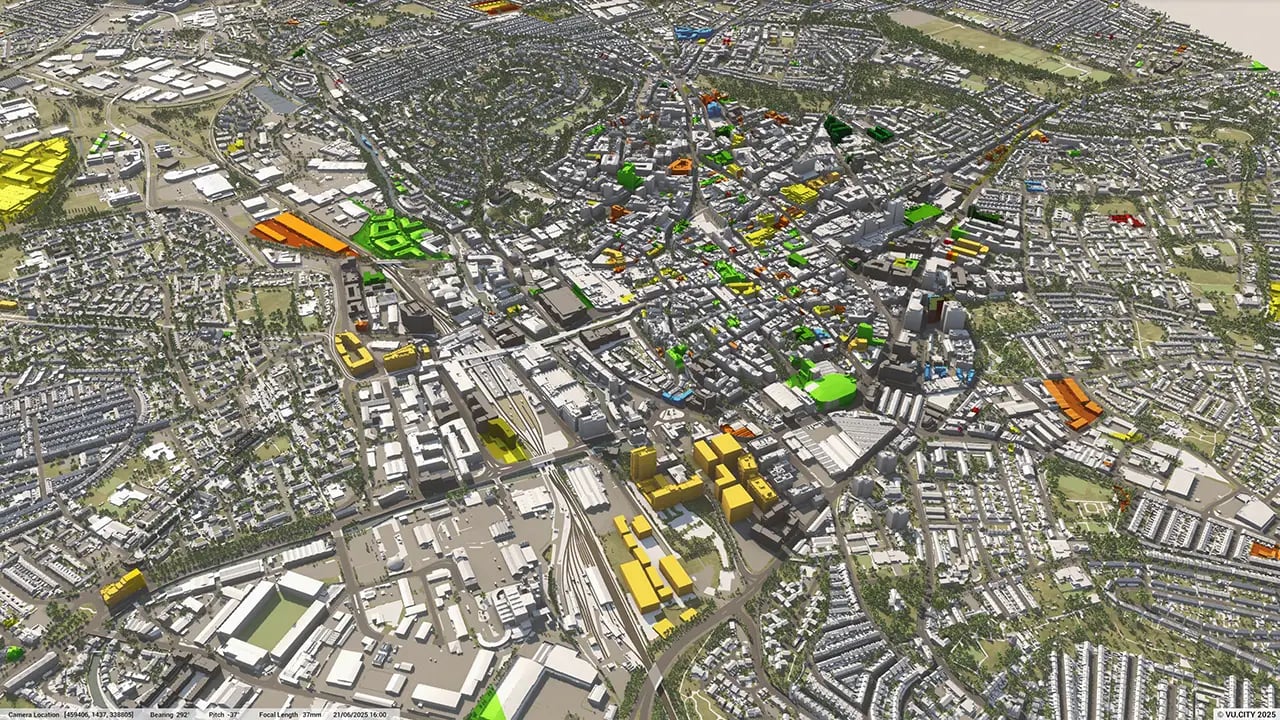
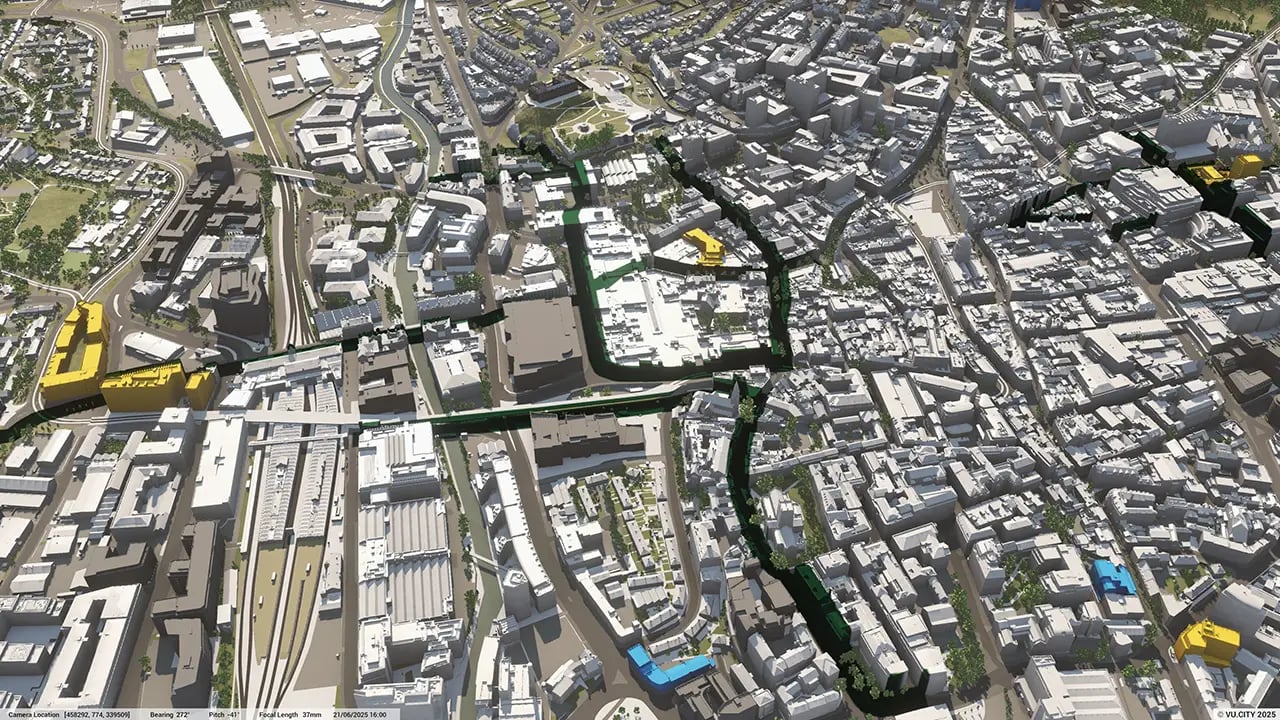
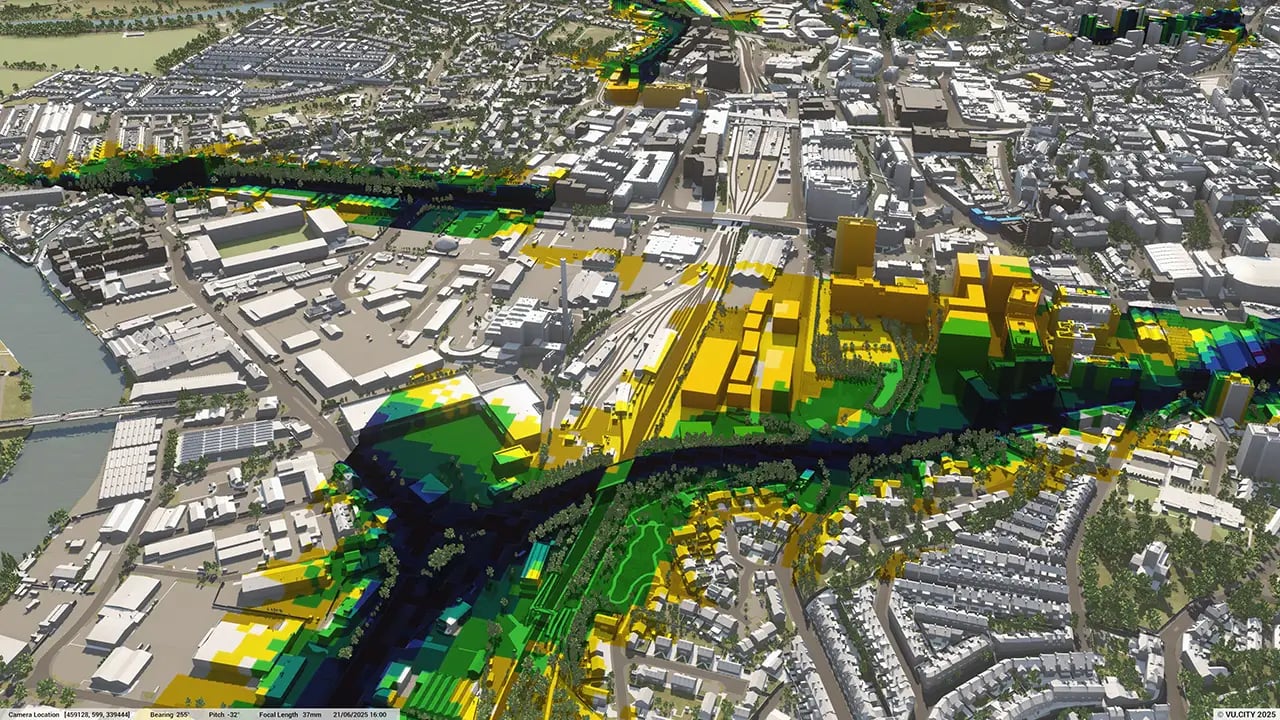
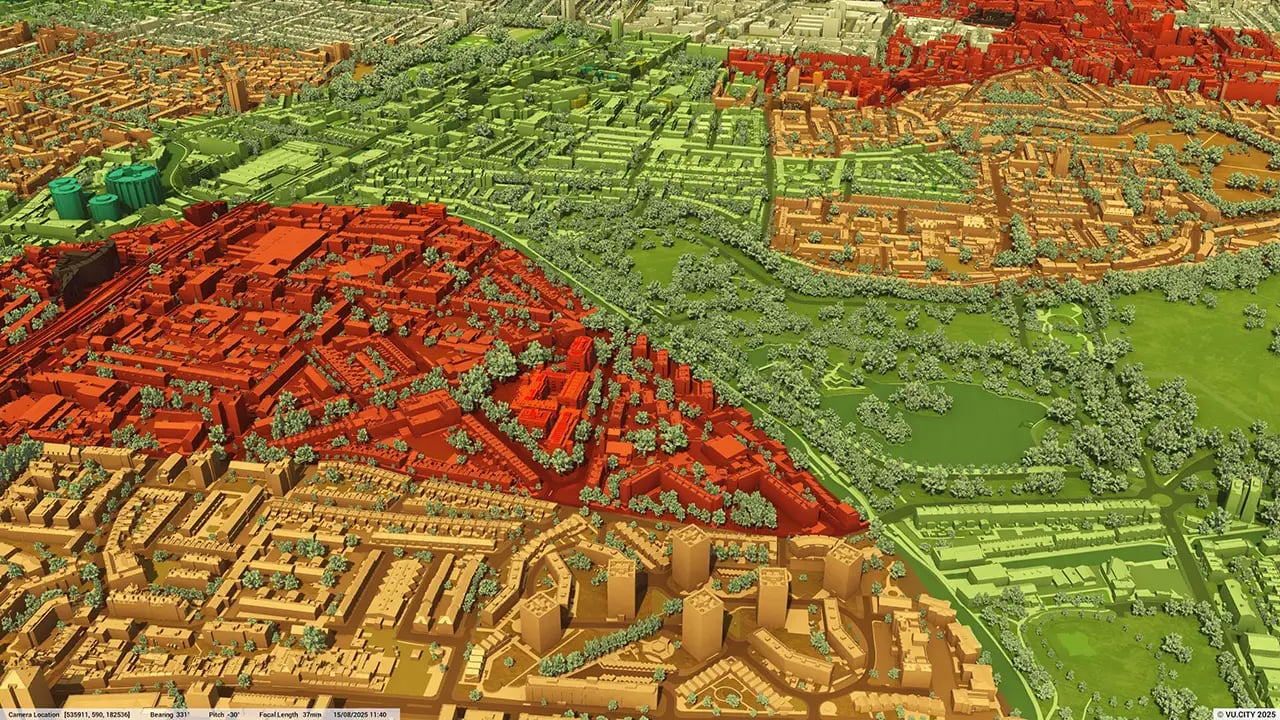
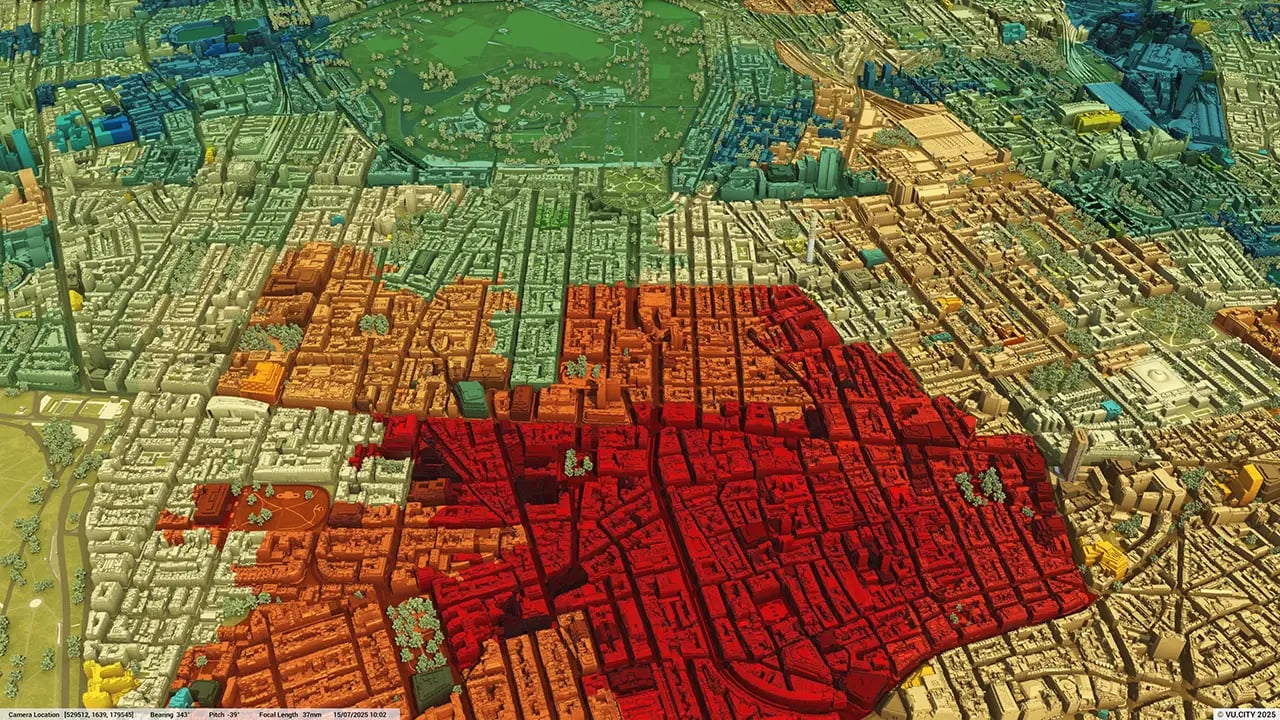
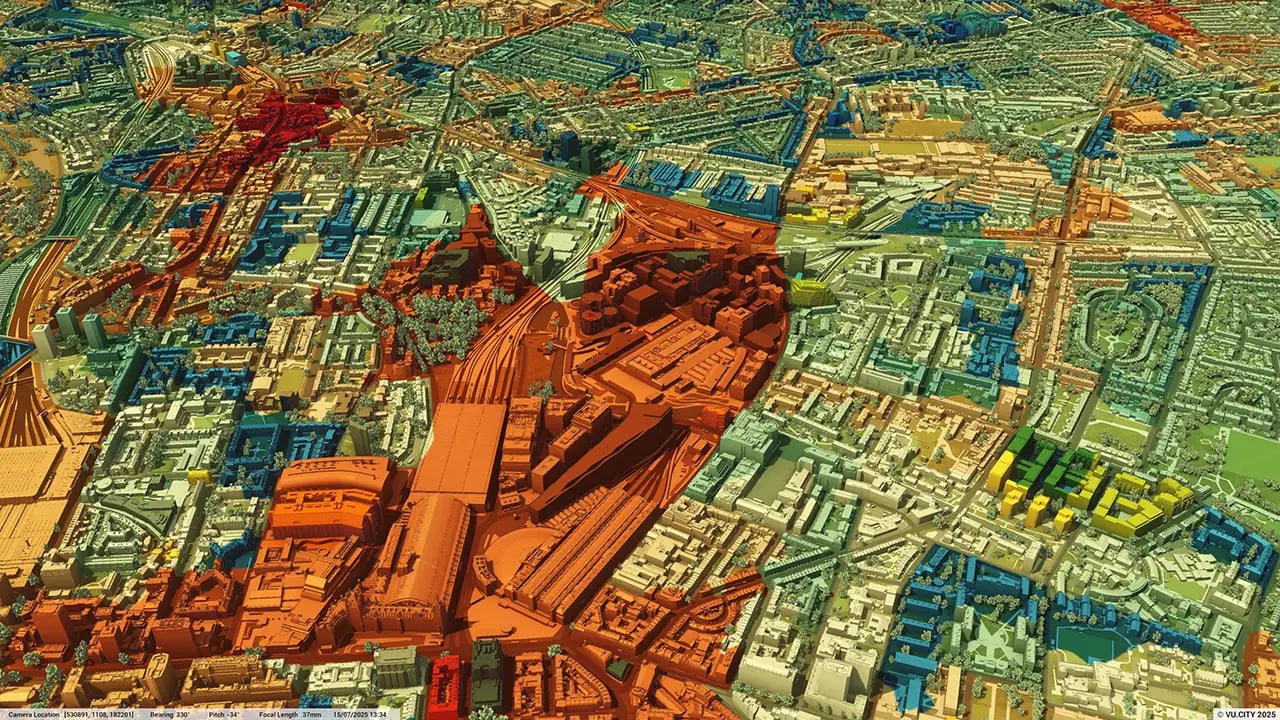
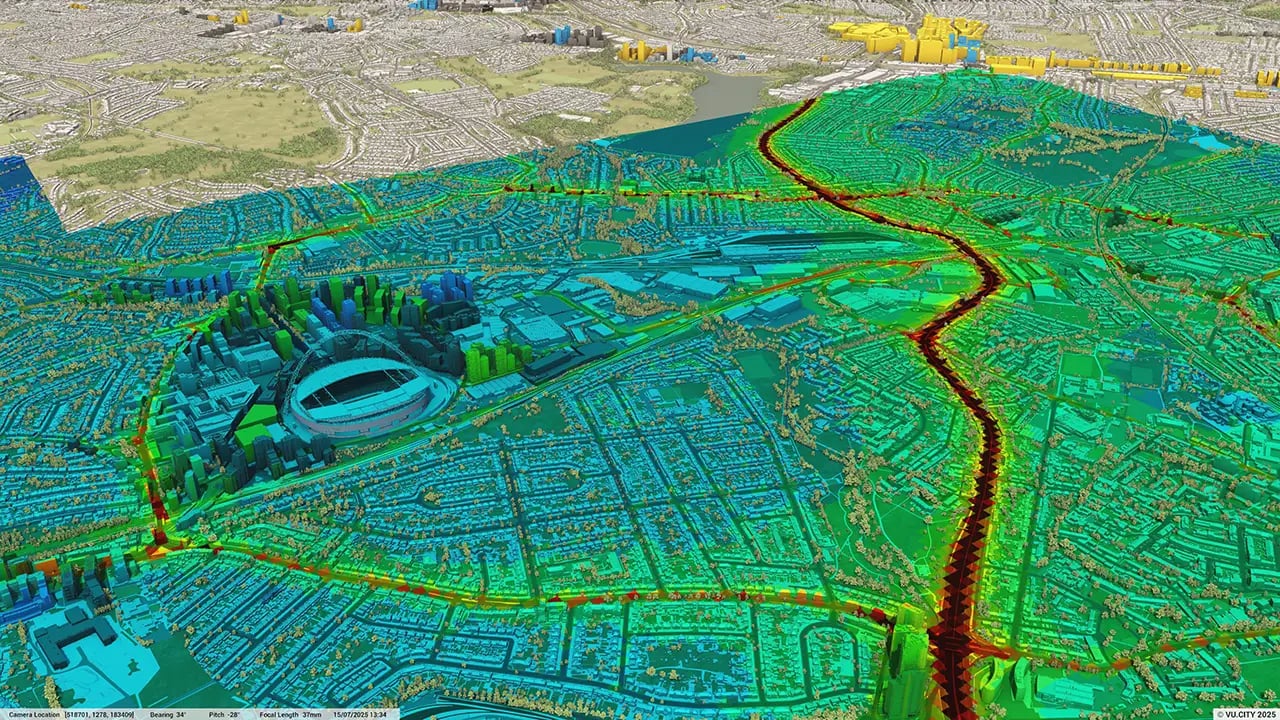
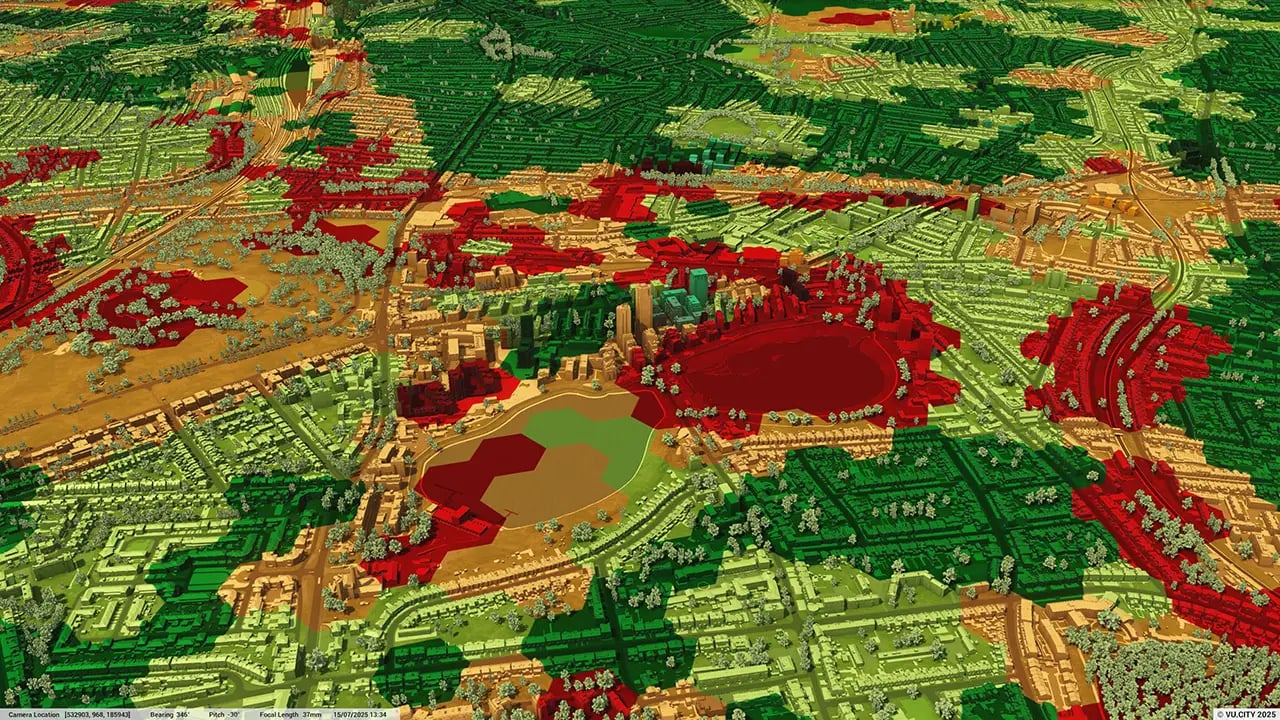
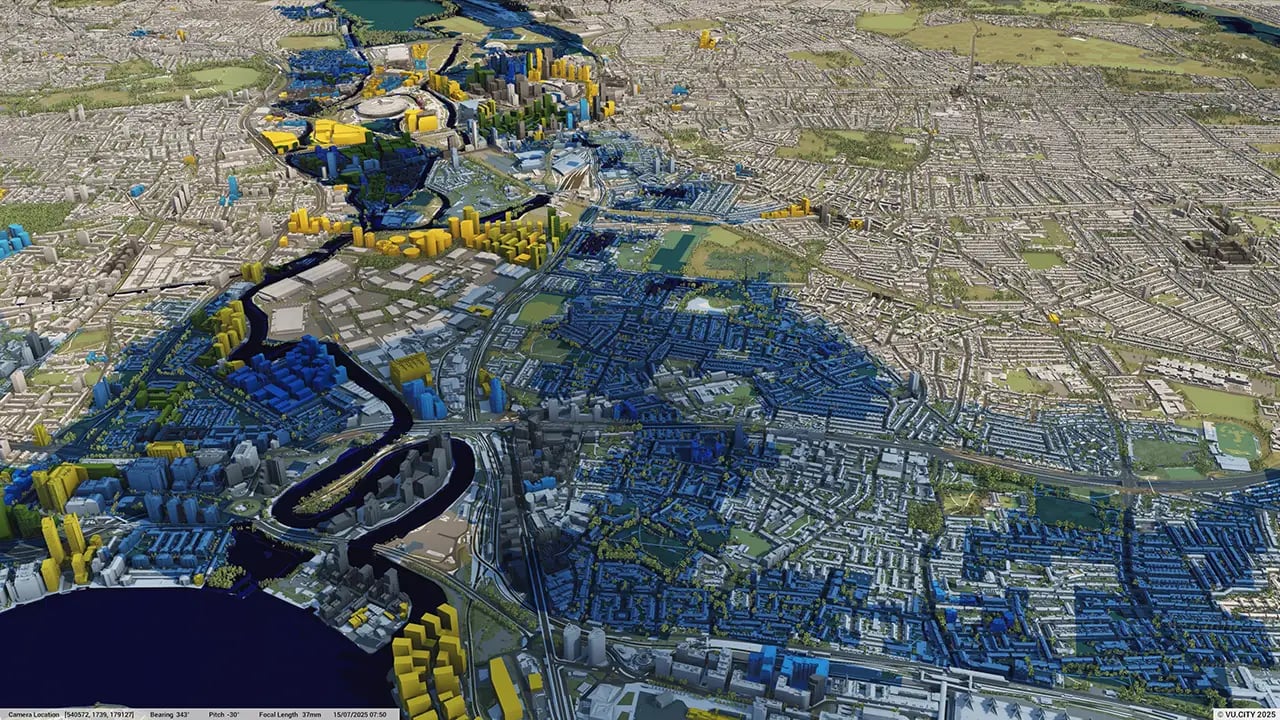
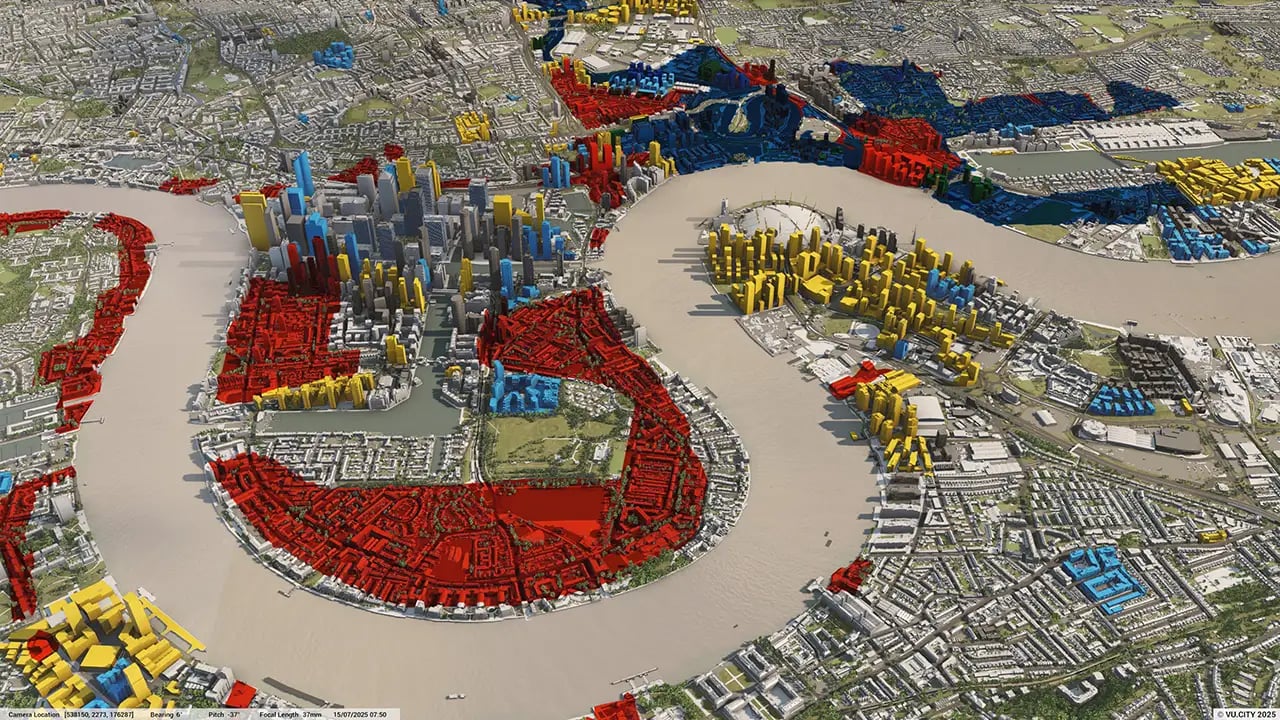
Nottingham data layers
From transportation and zoning to environmental factors, VU.CITY Nottingham 3D model data layers provide essential insights for more informed and confident decision-making.


Trusted by 6,000+ users across 26 cities
Architects, developers, local authorities, urban planners, and more trust VU.CITY to help achieve their goals.
Organise and visualise your geospatial data in accurate context with our comprehensive suite of digital design and development tools.
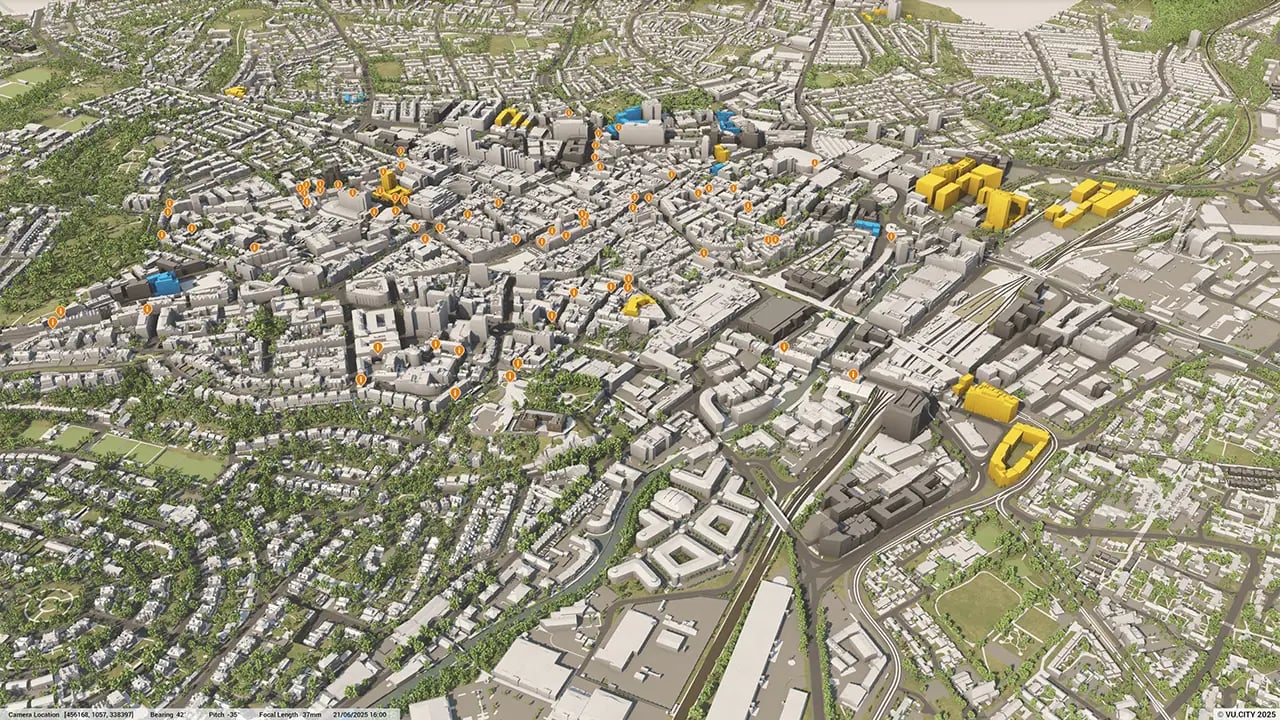
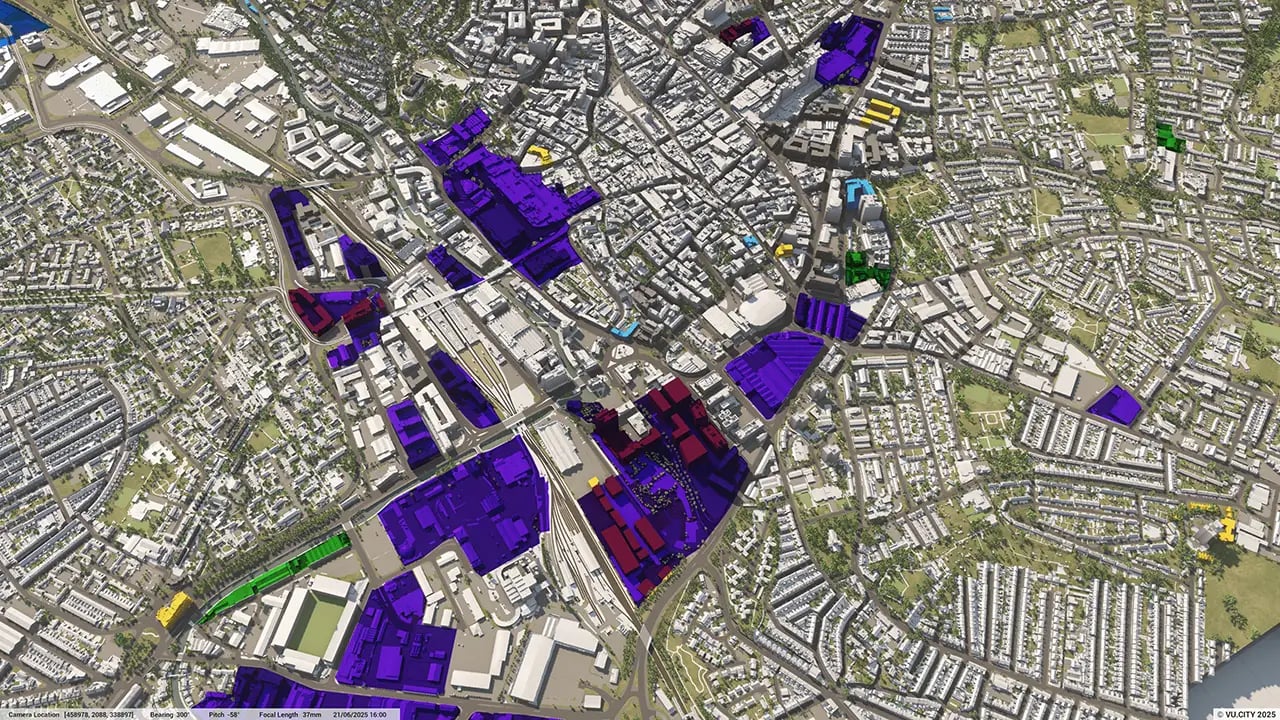
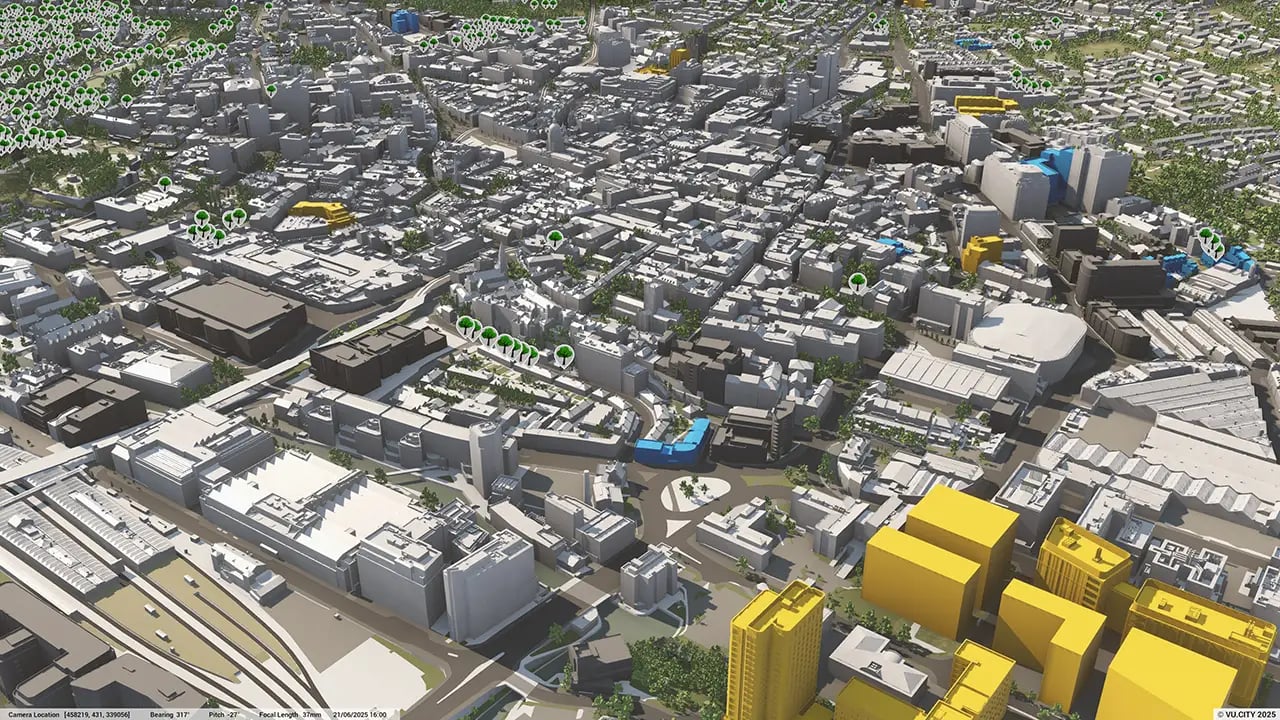
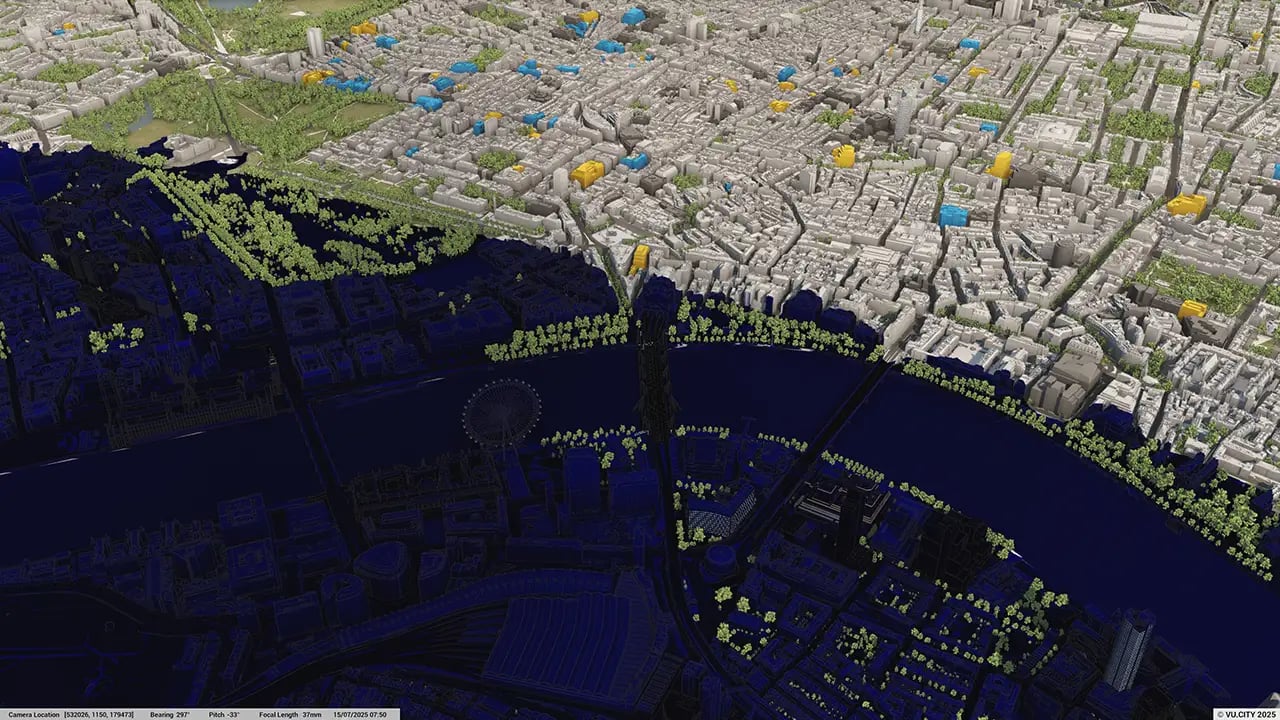
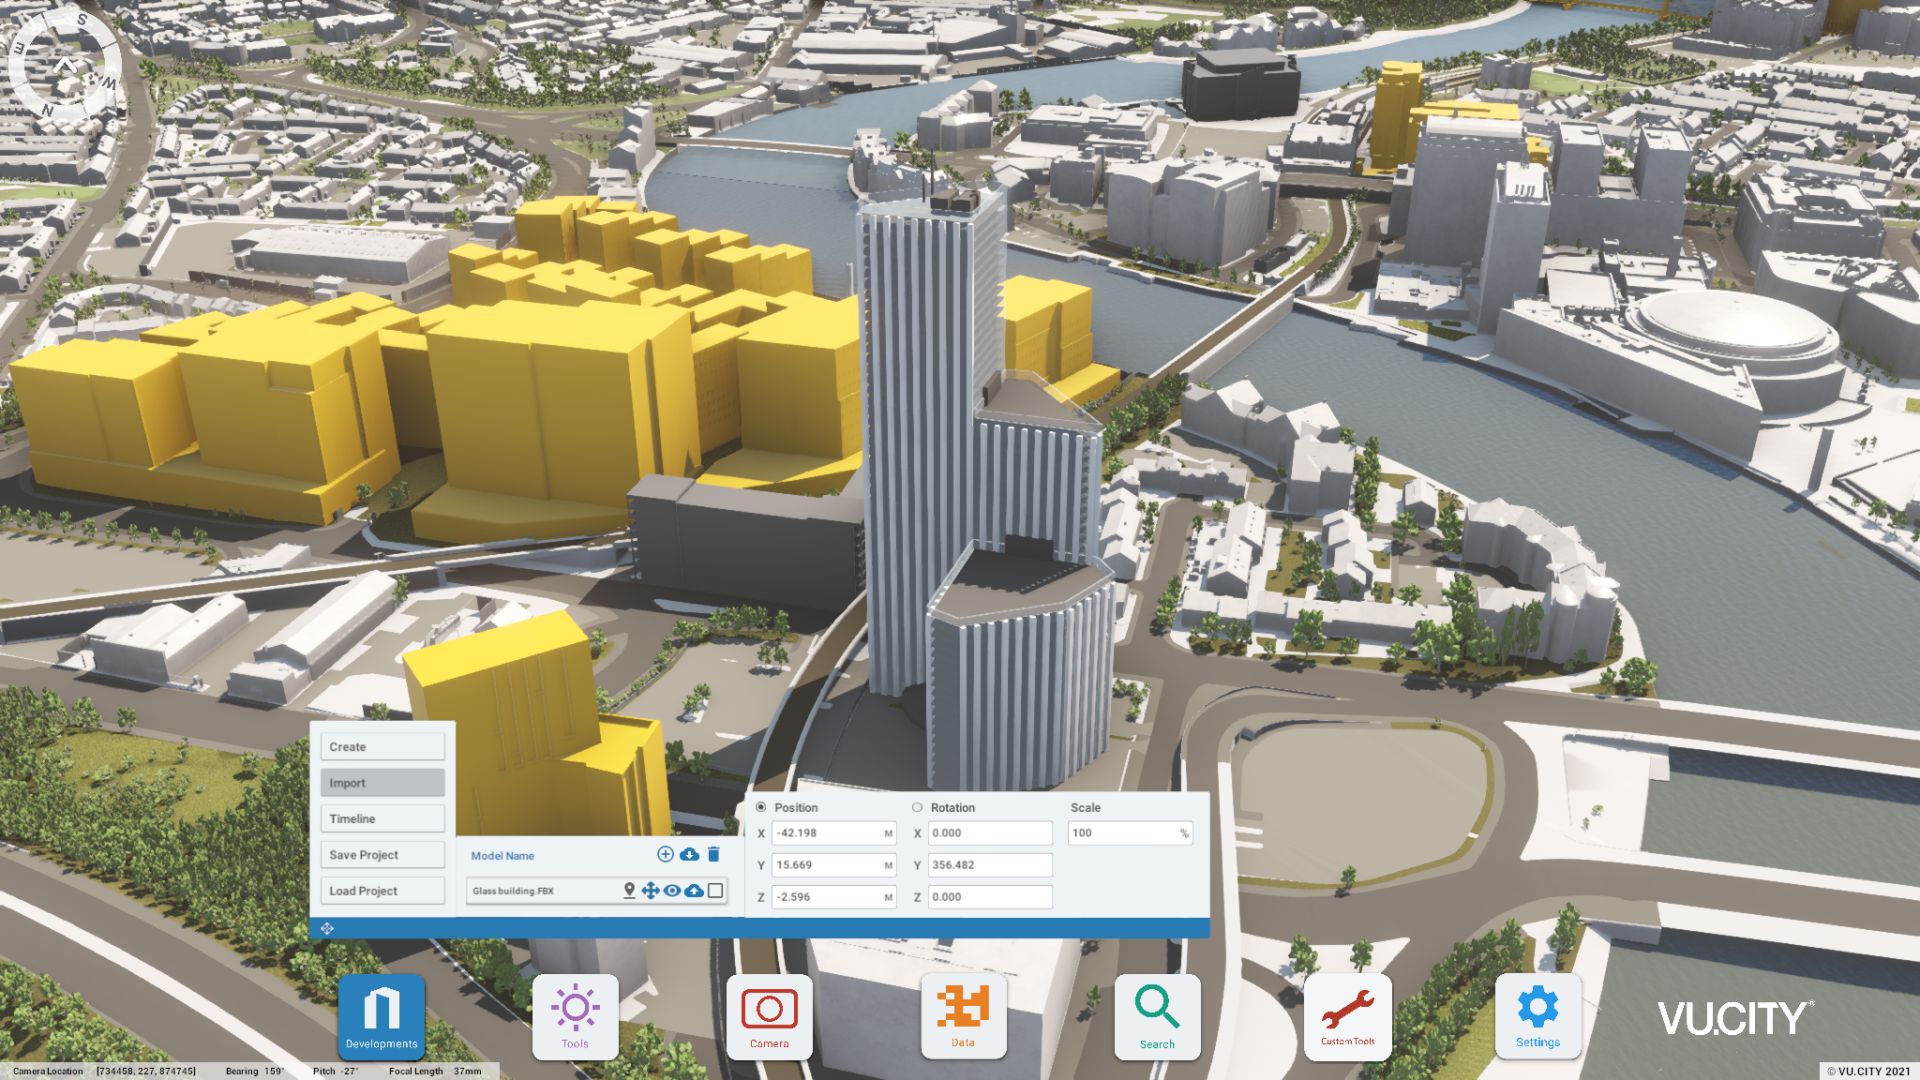
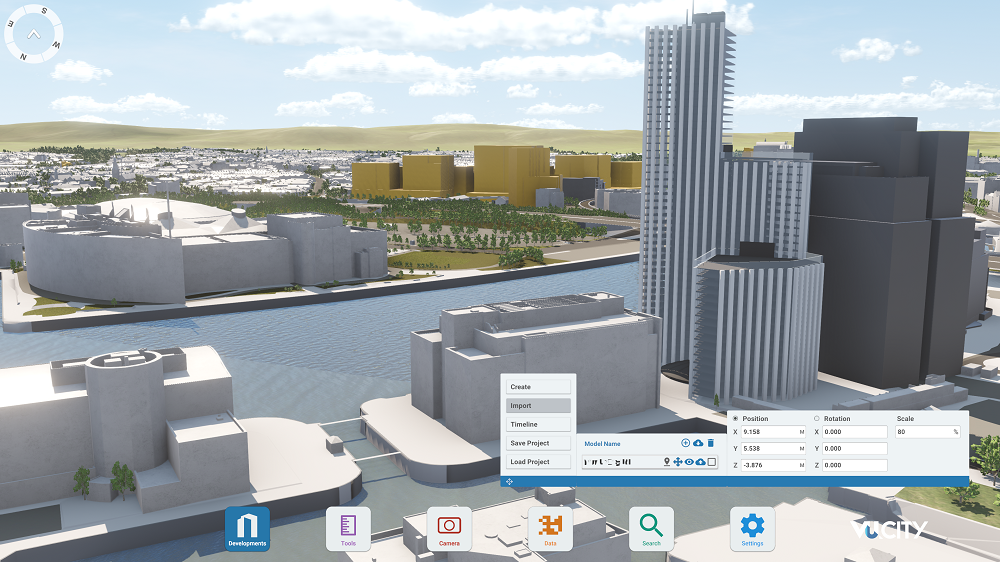
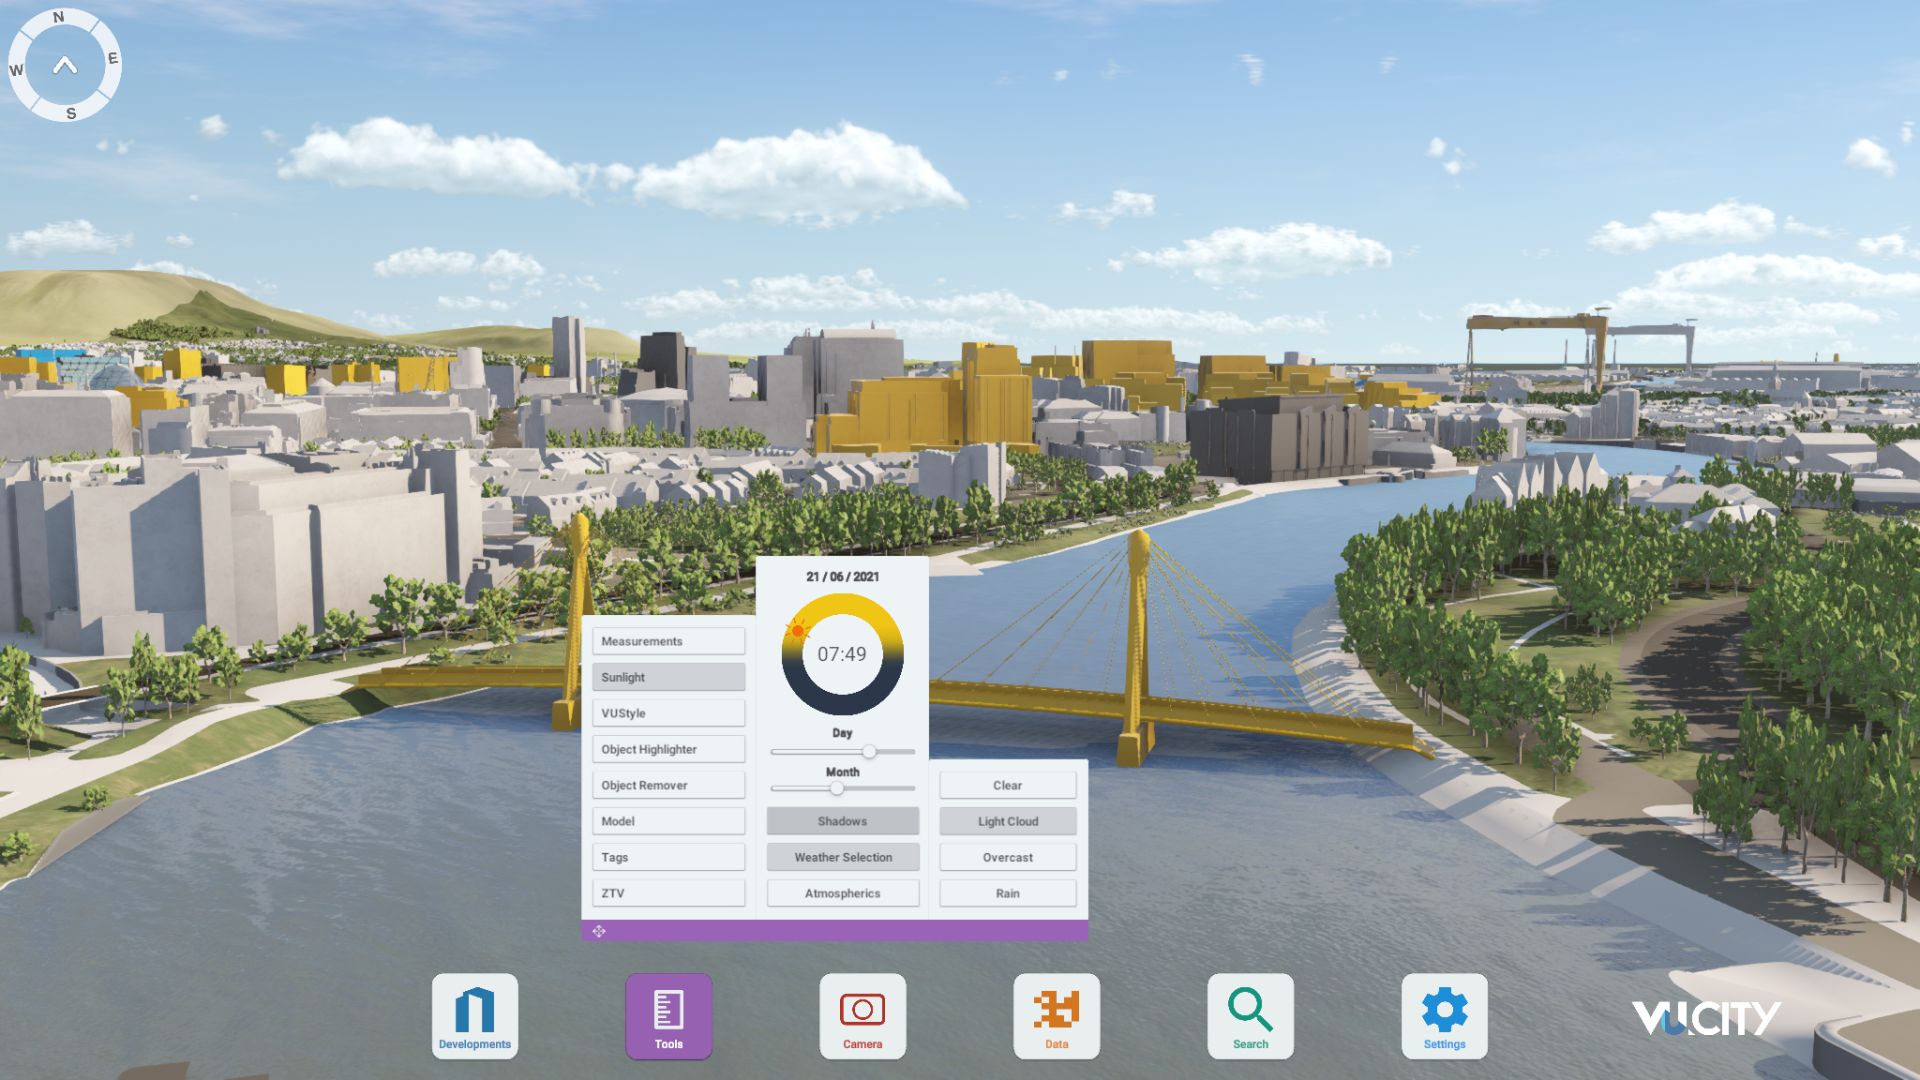
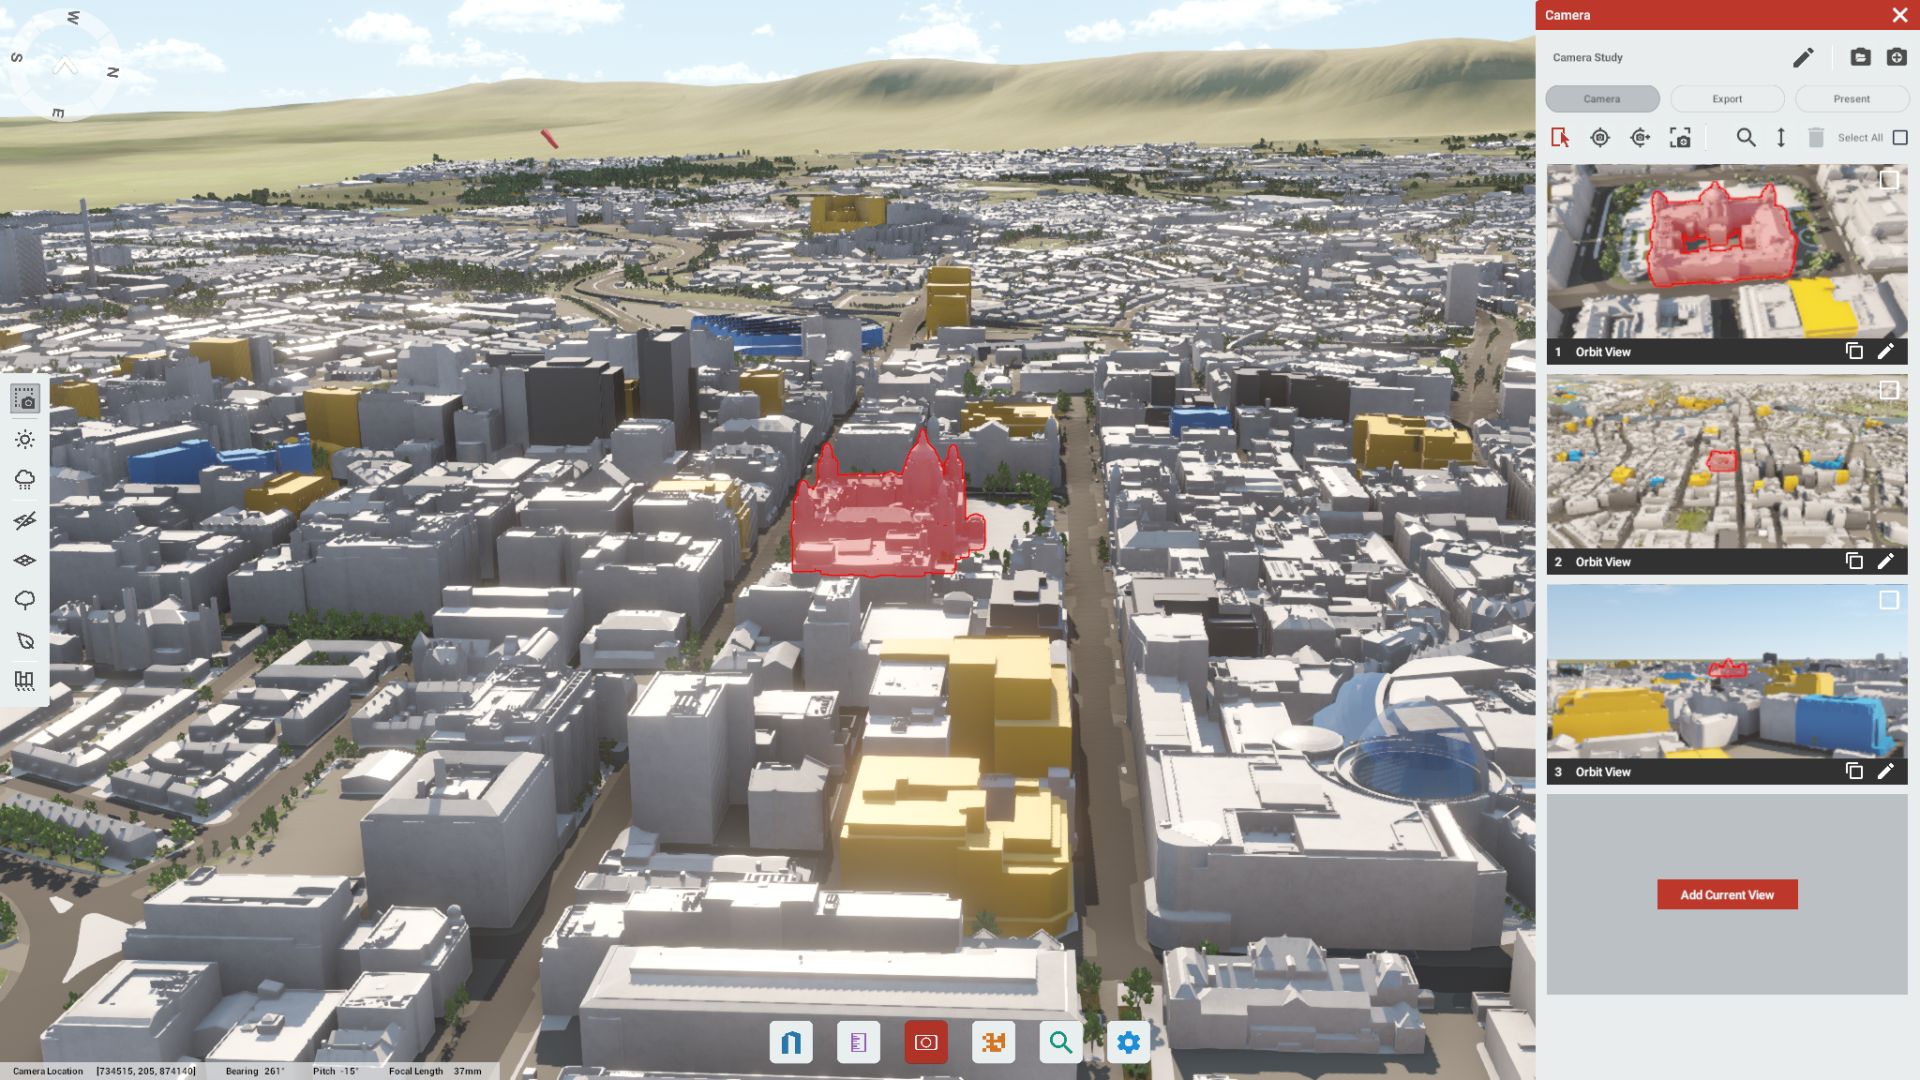
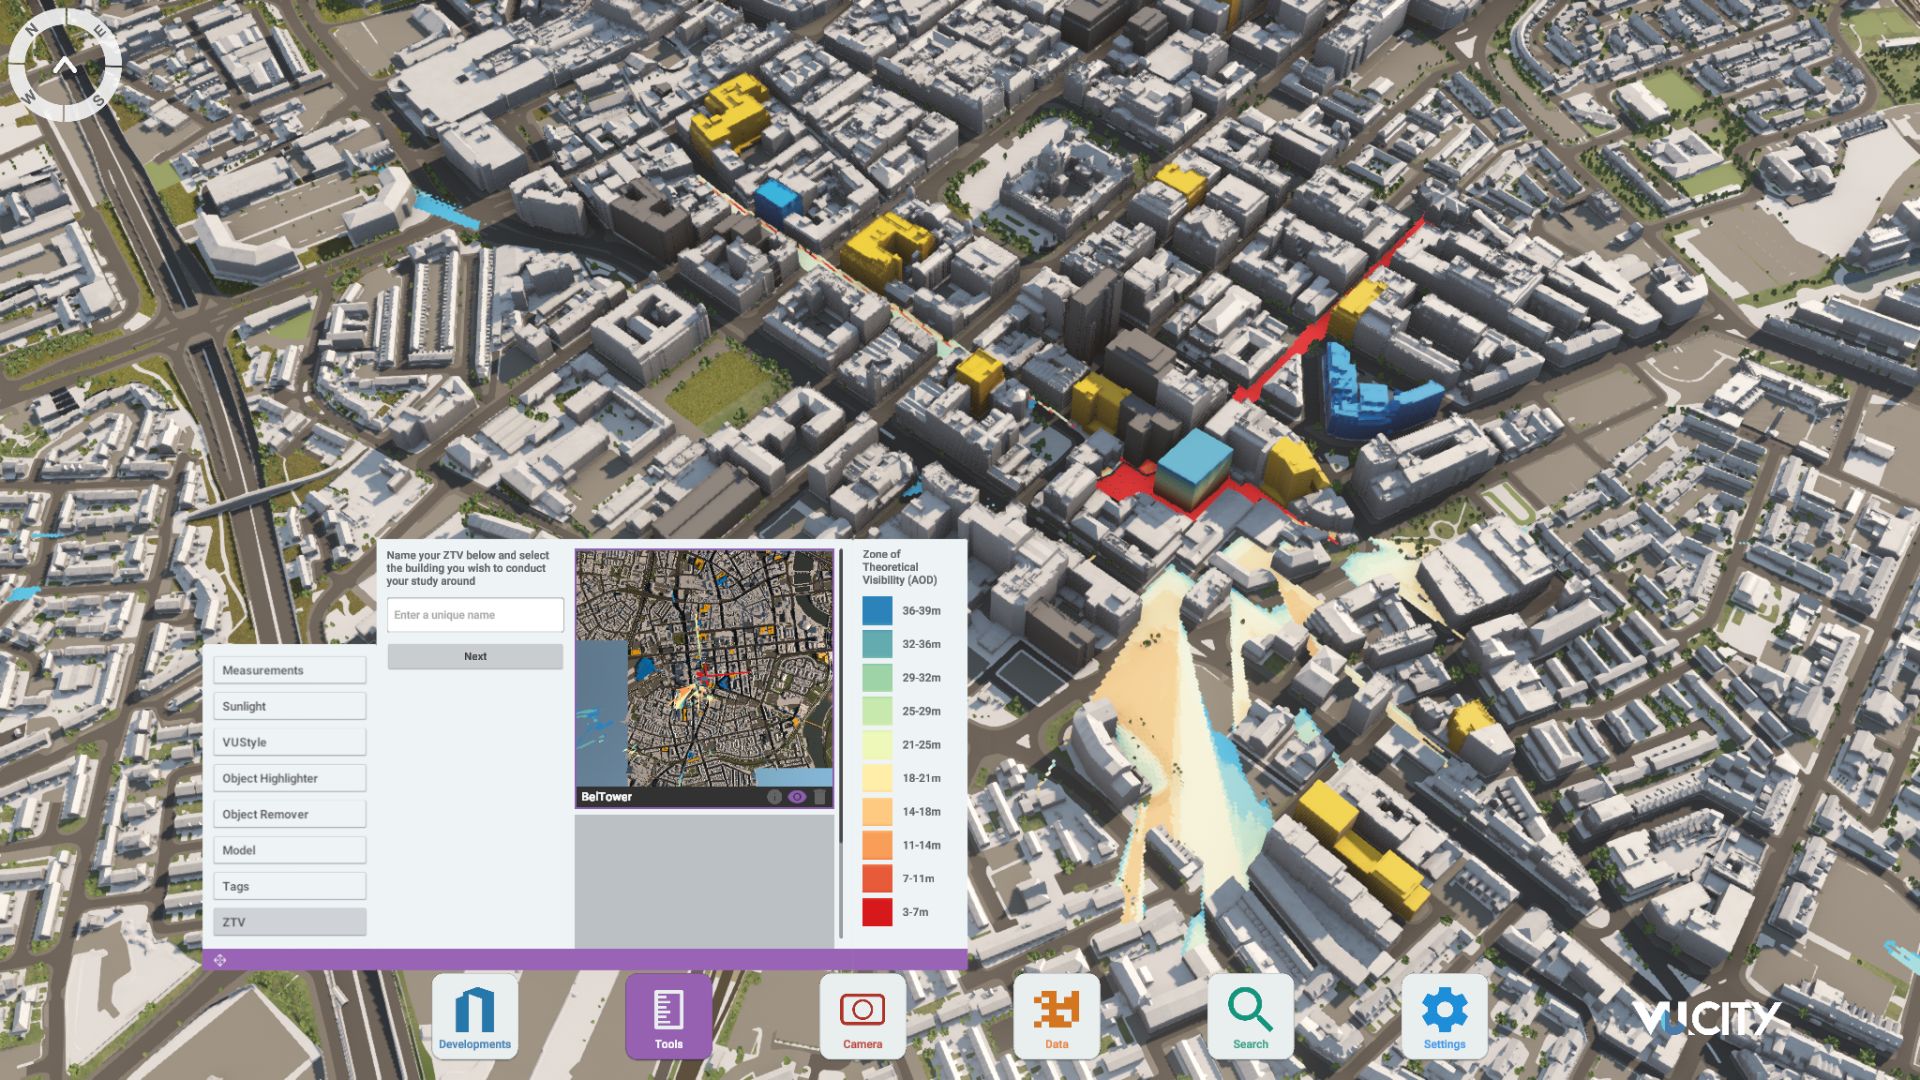
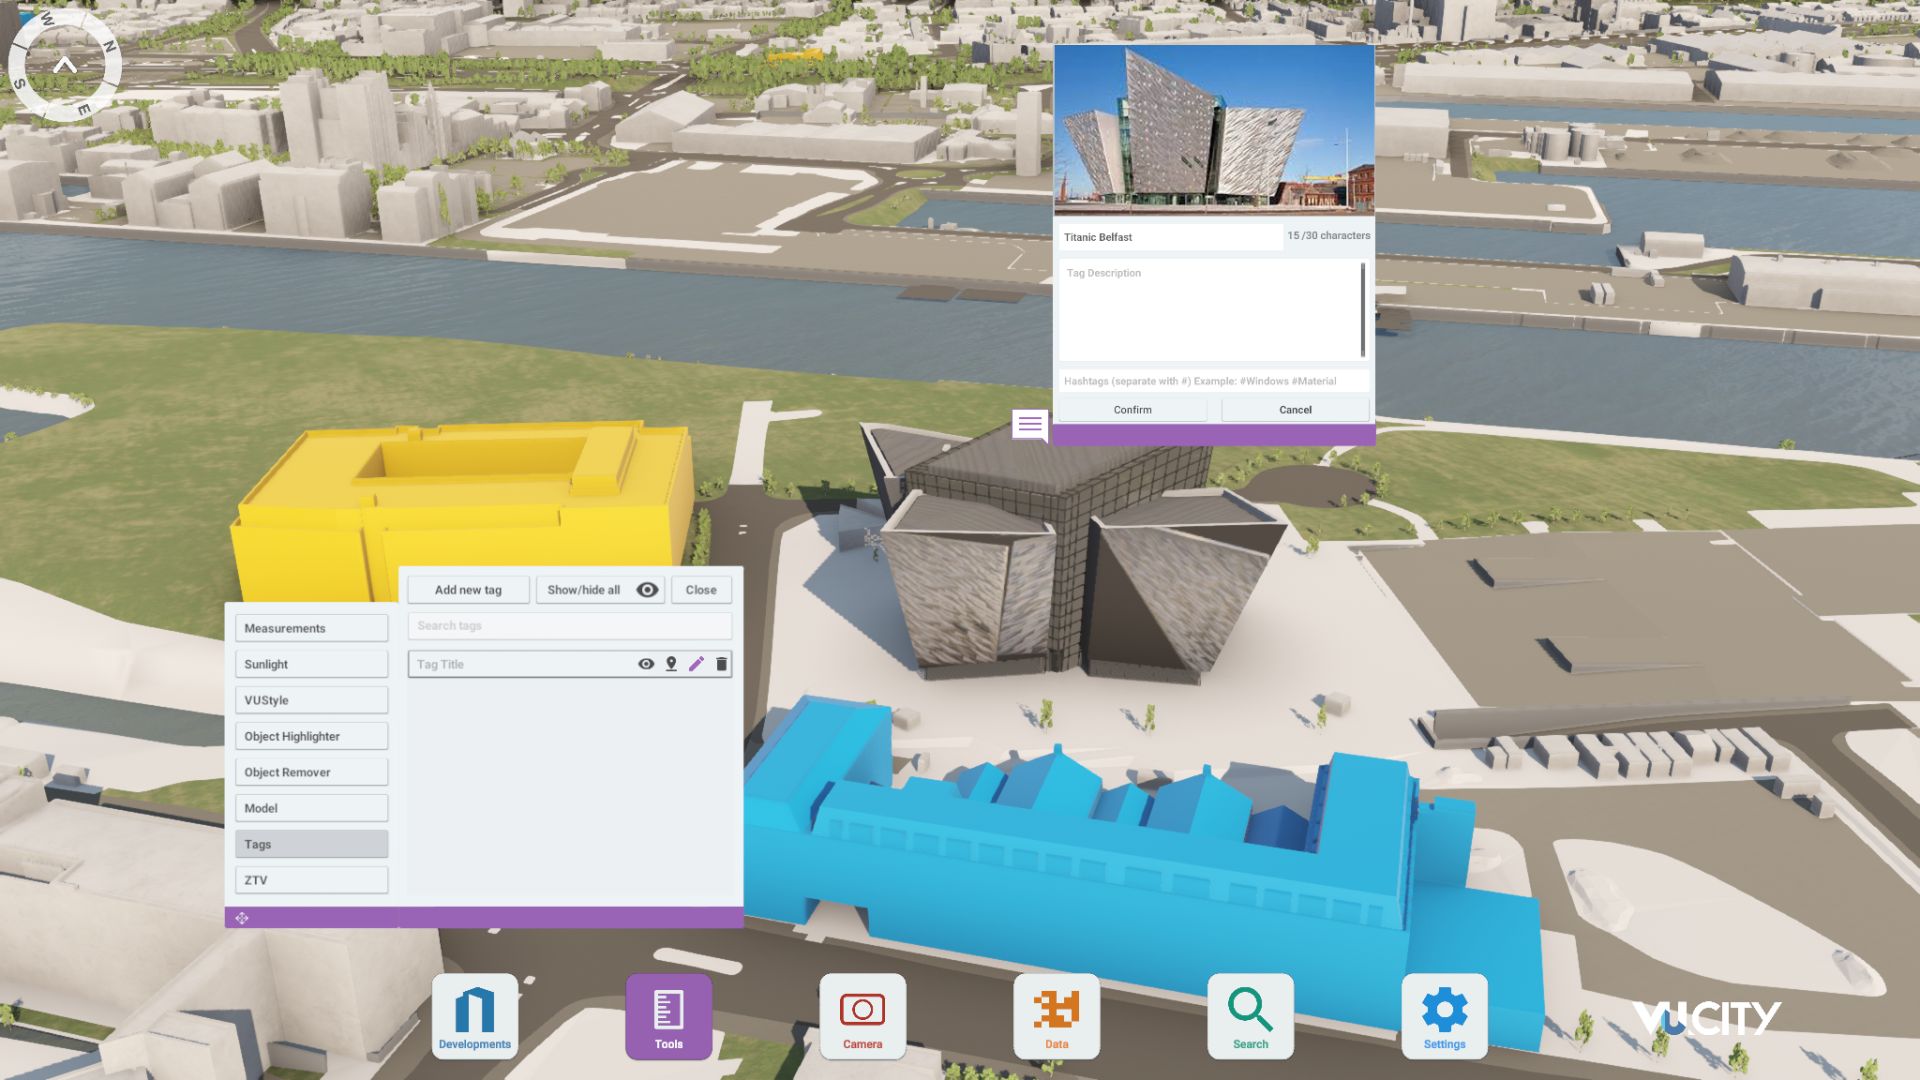
VU.CITY Nottingham: 3D Model Features and Planning Tools
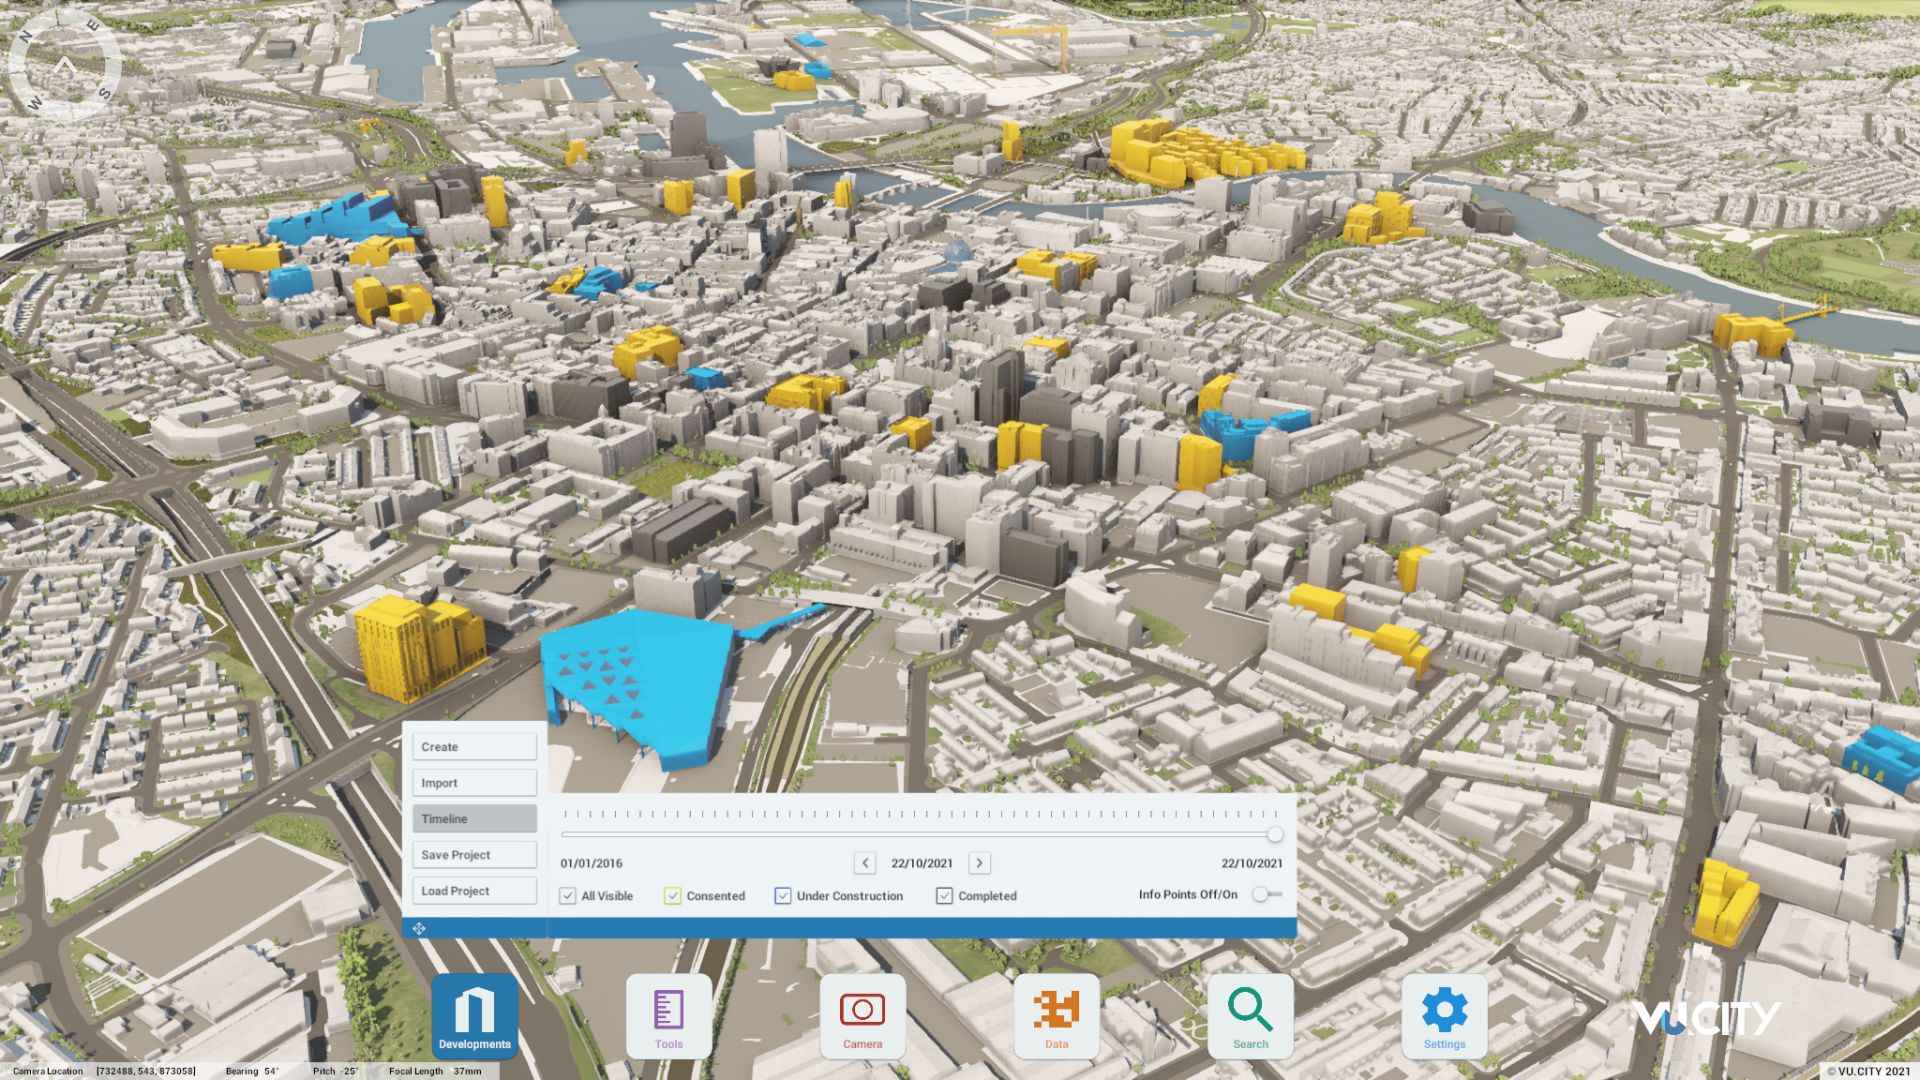
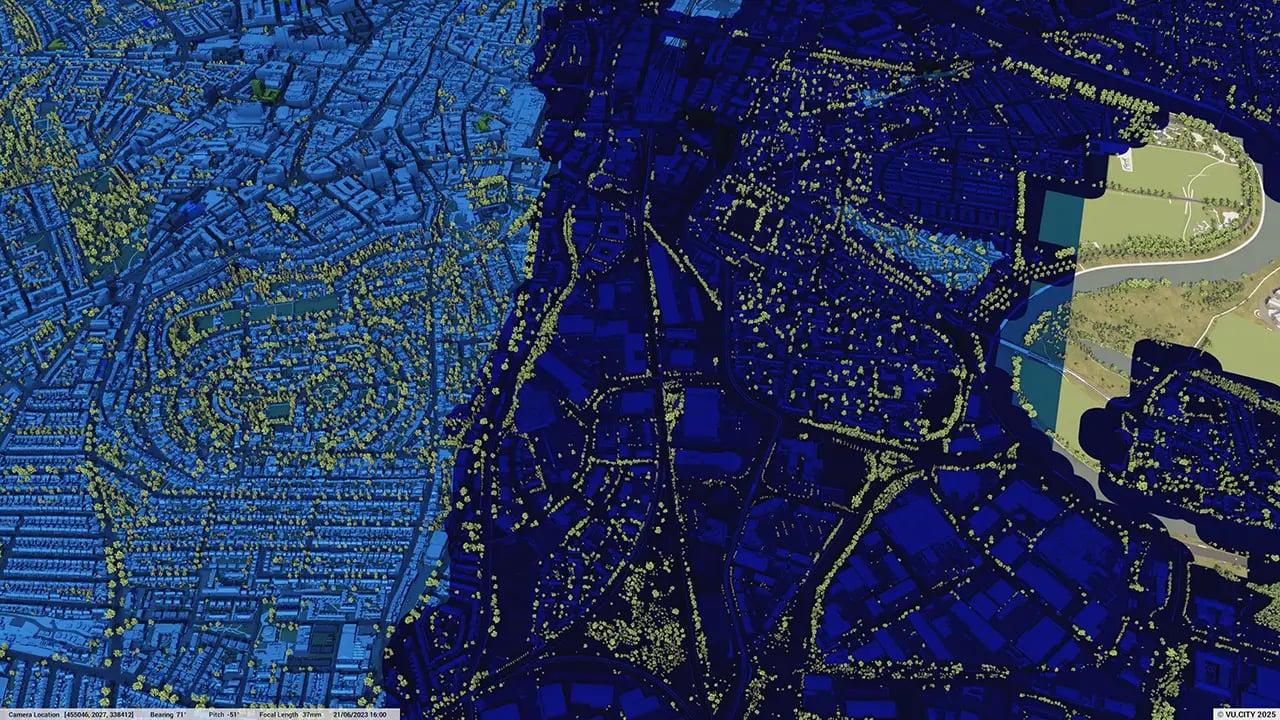
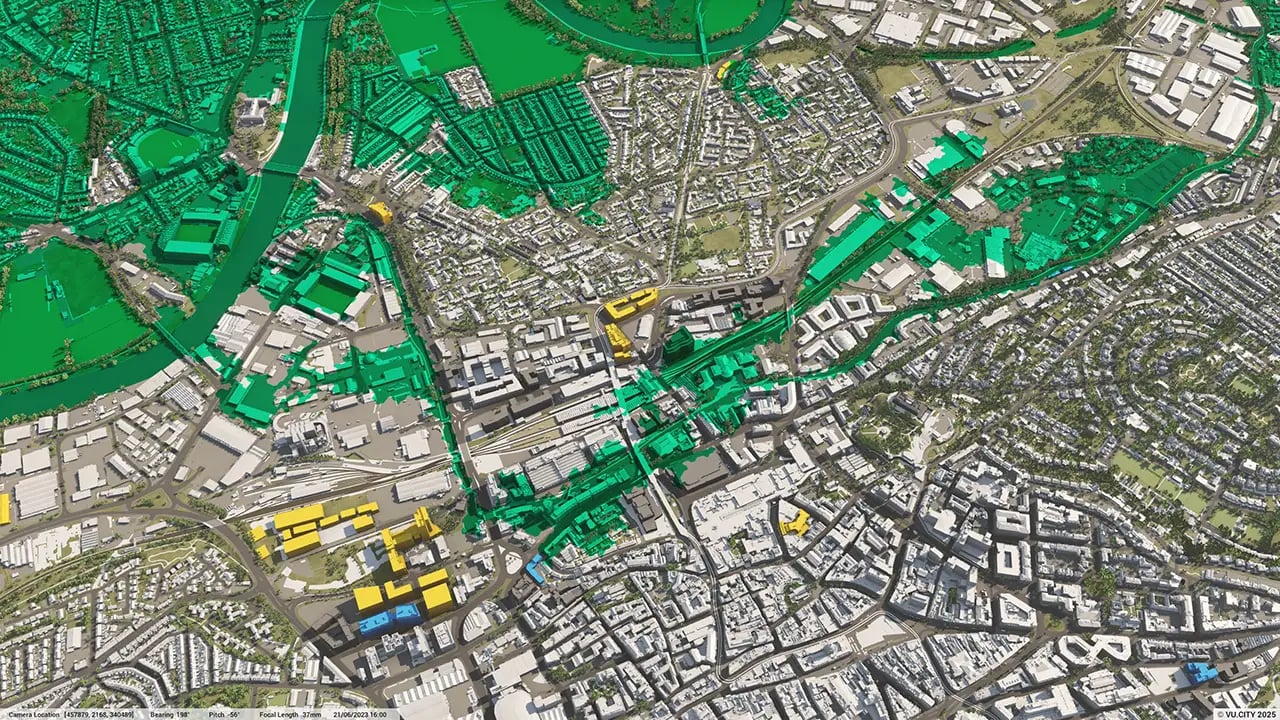
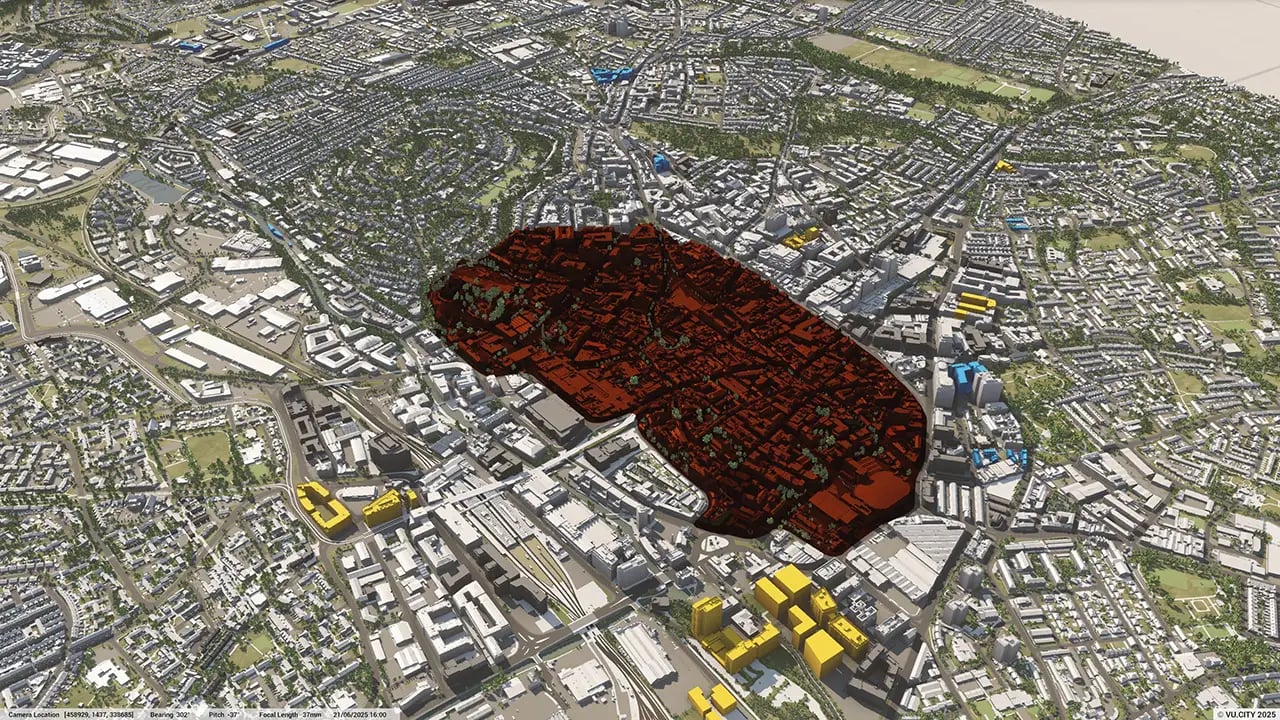
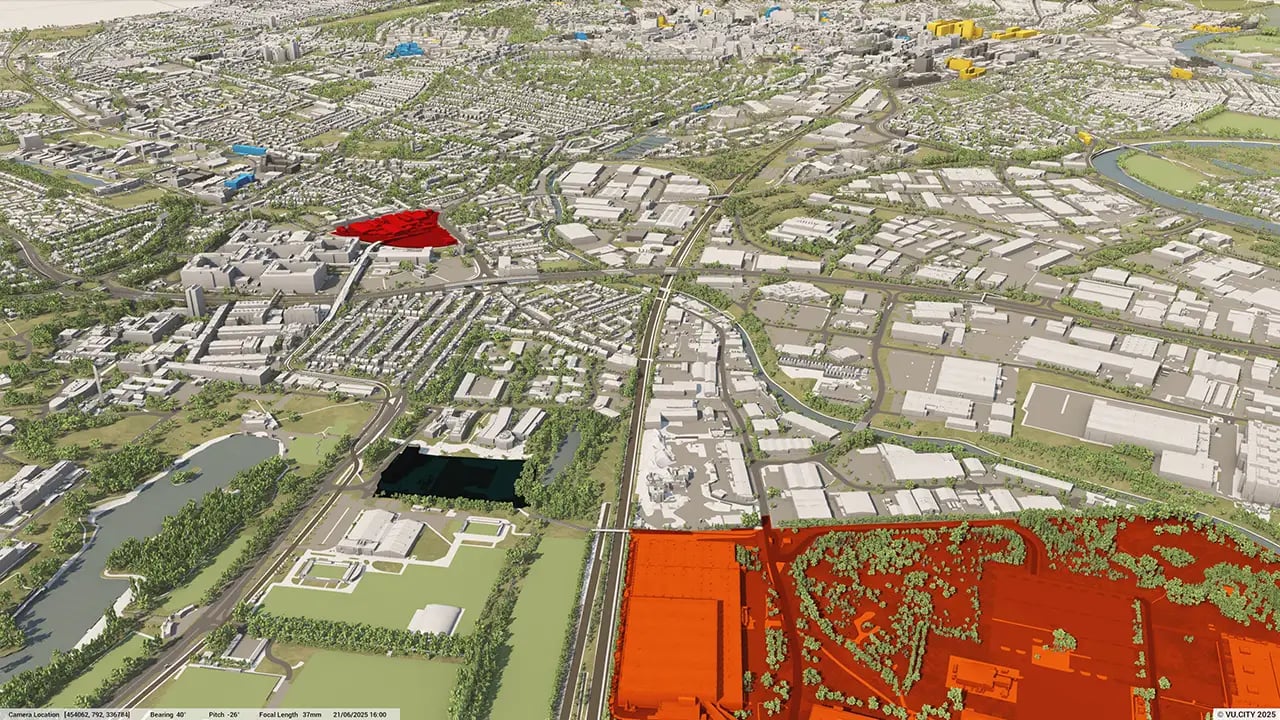
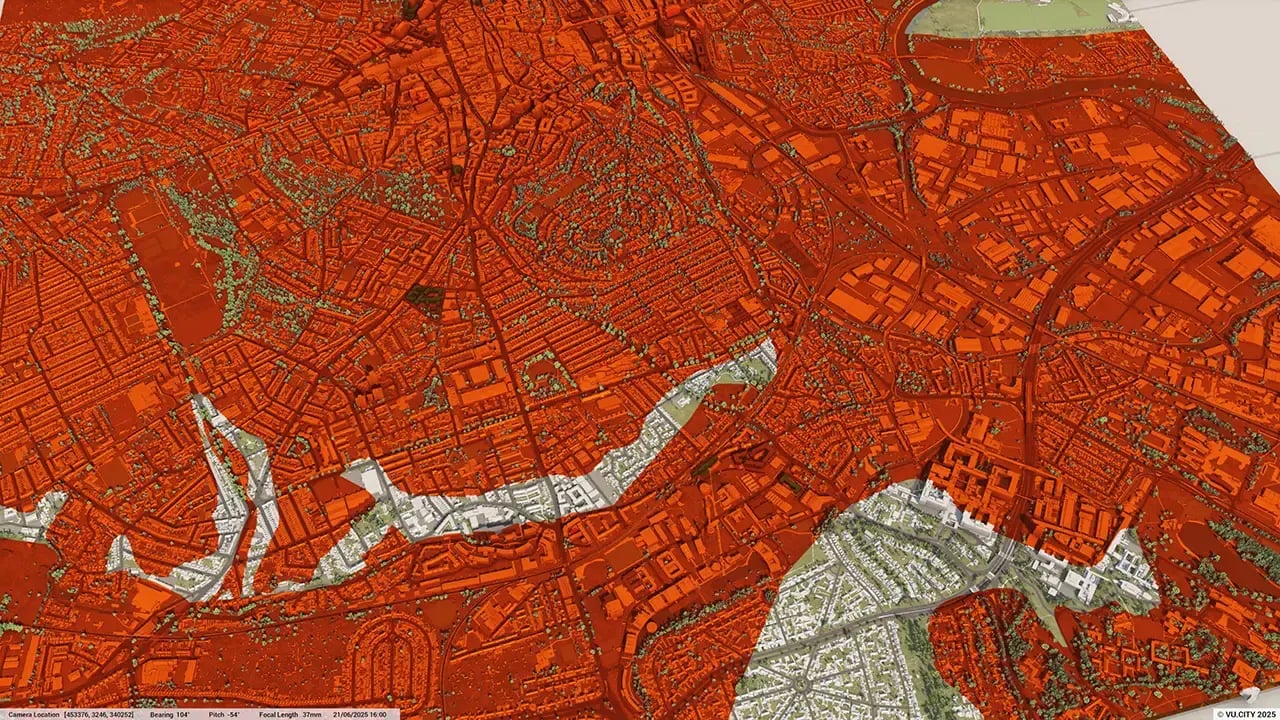
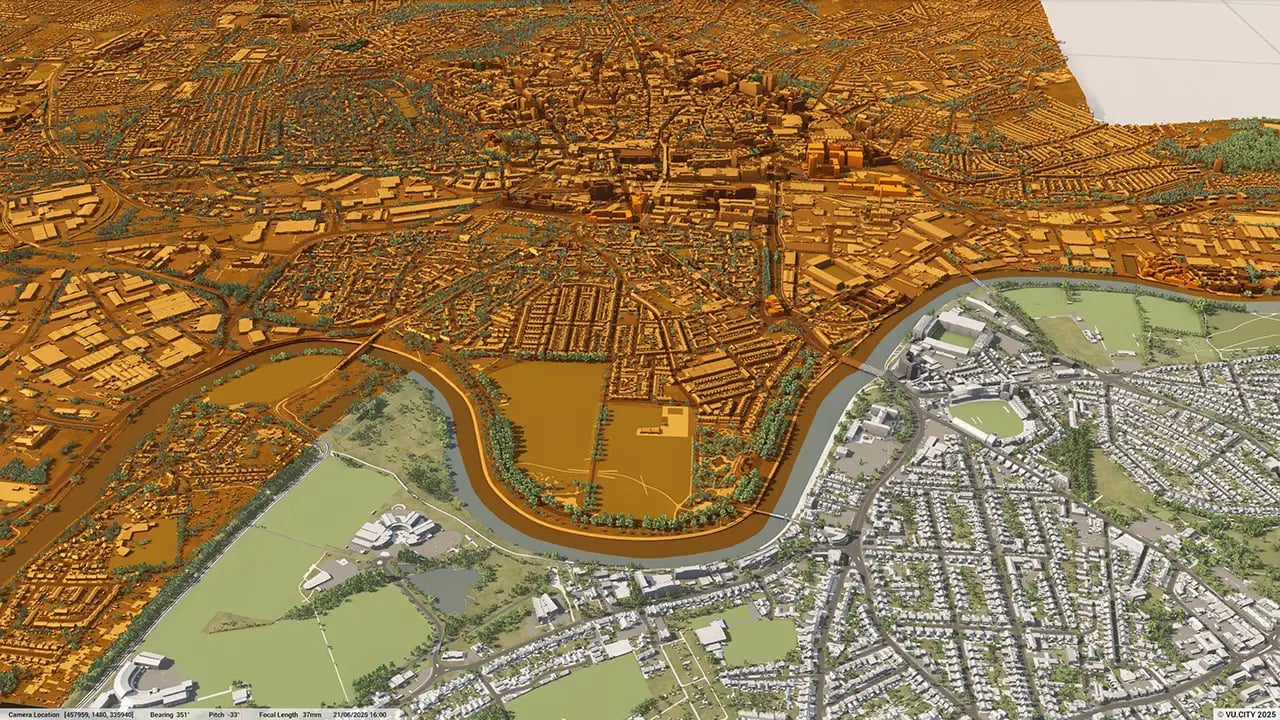
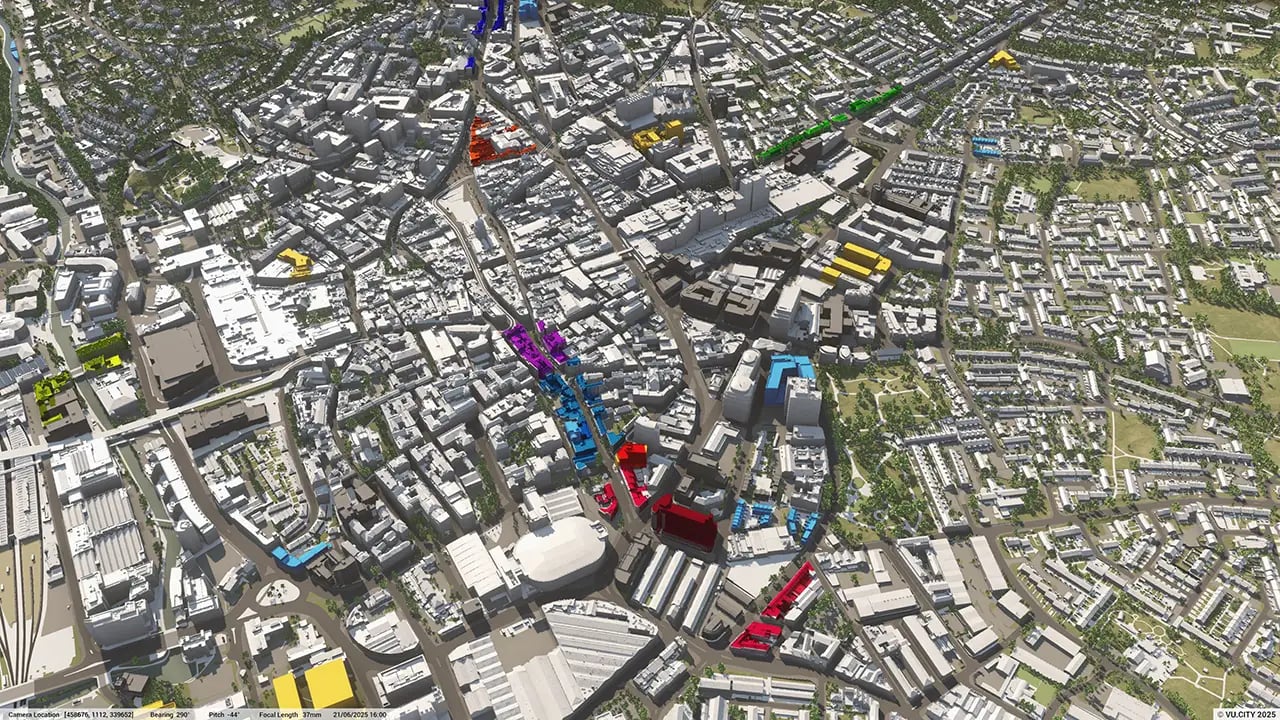
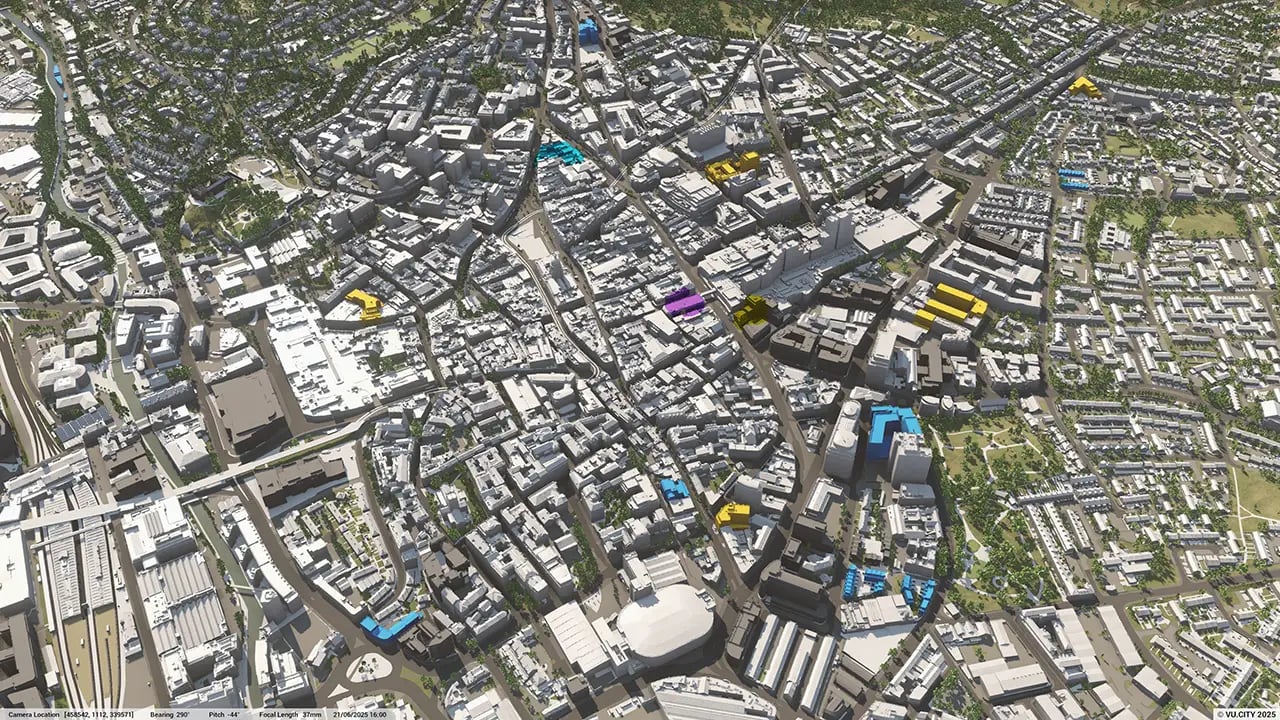
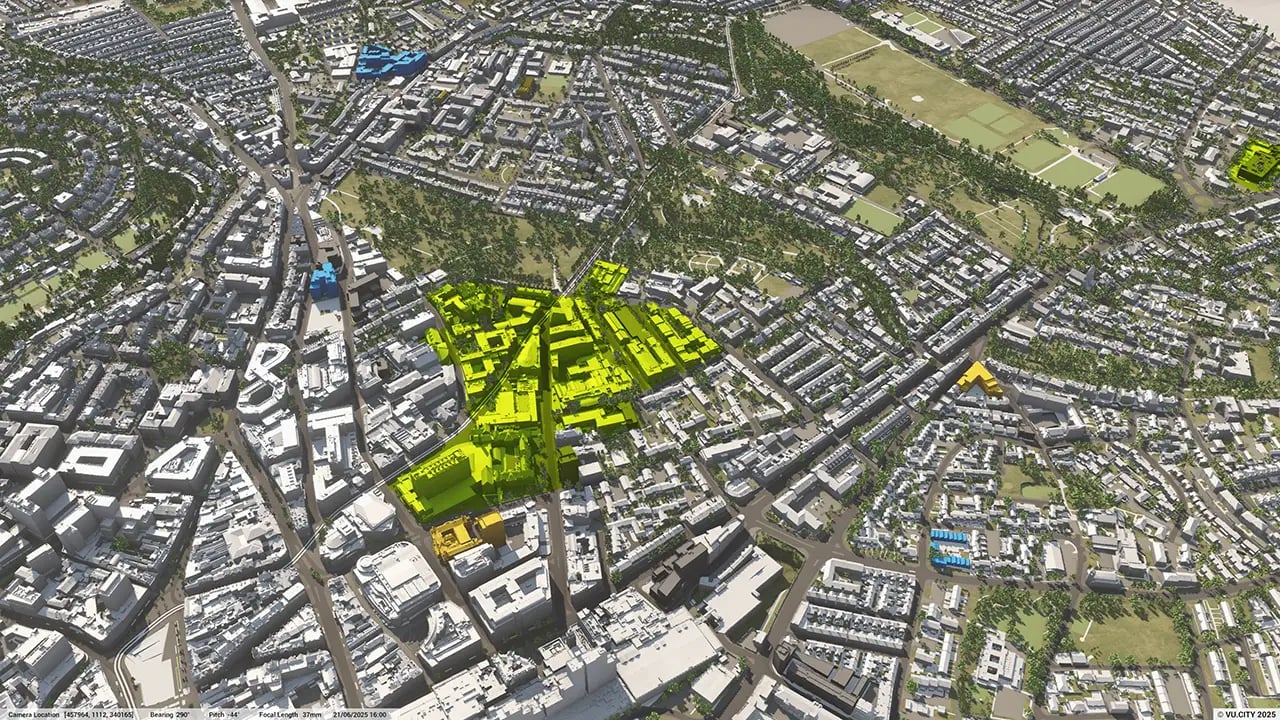
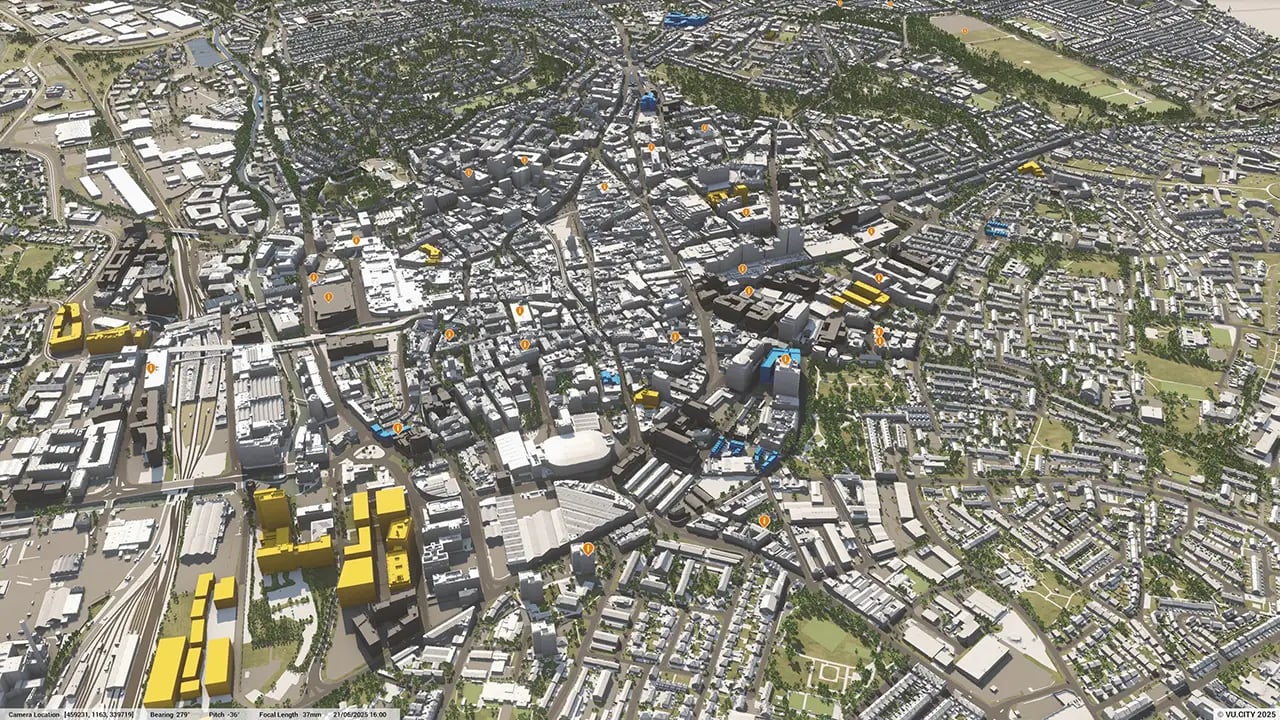
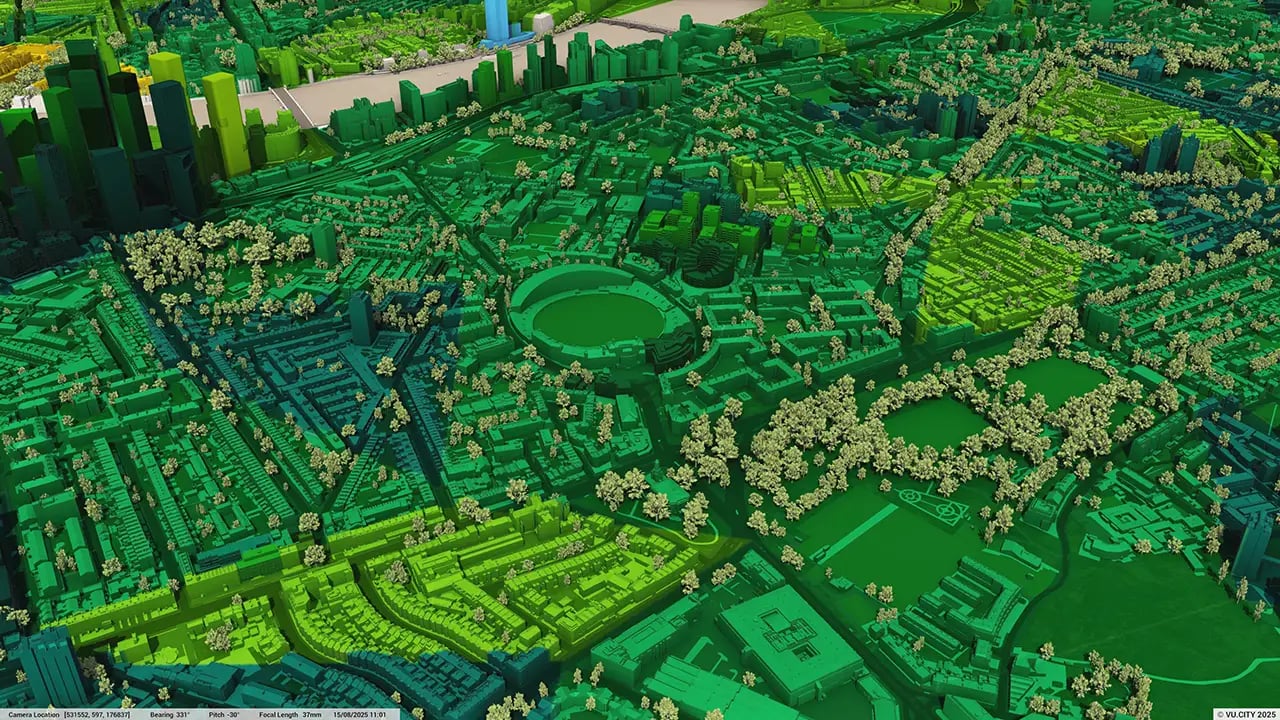
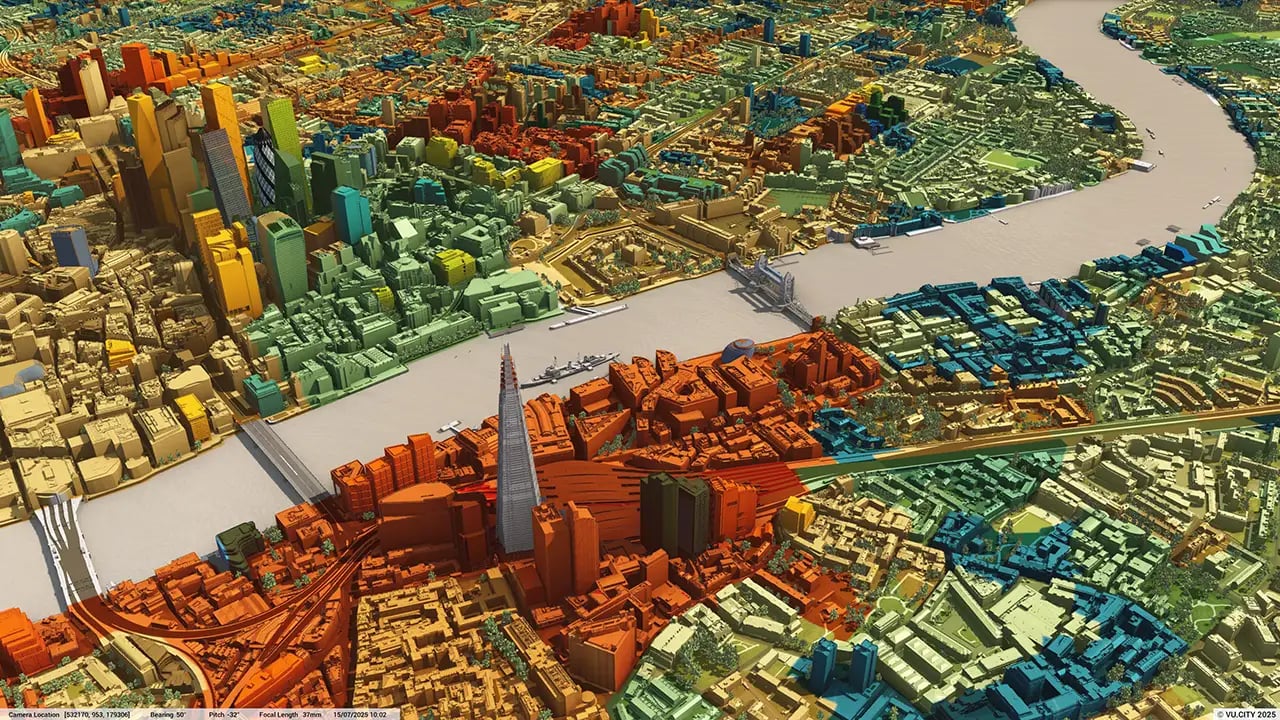
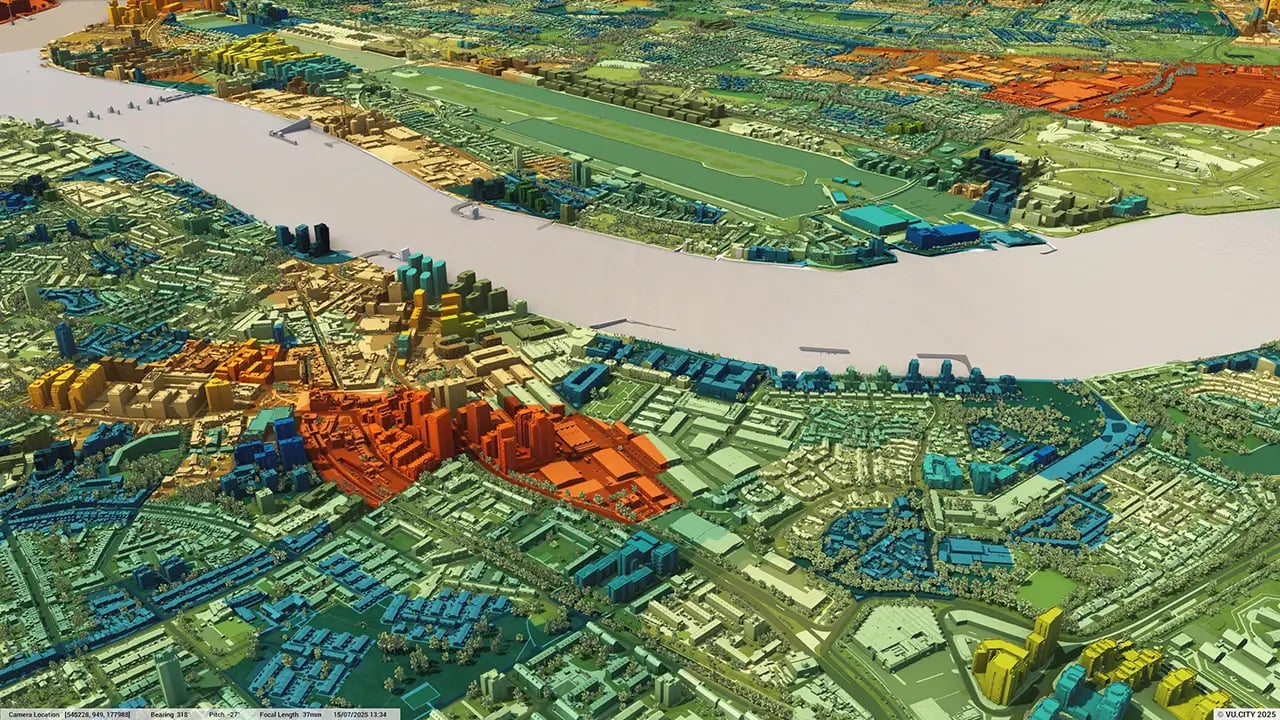
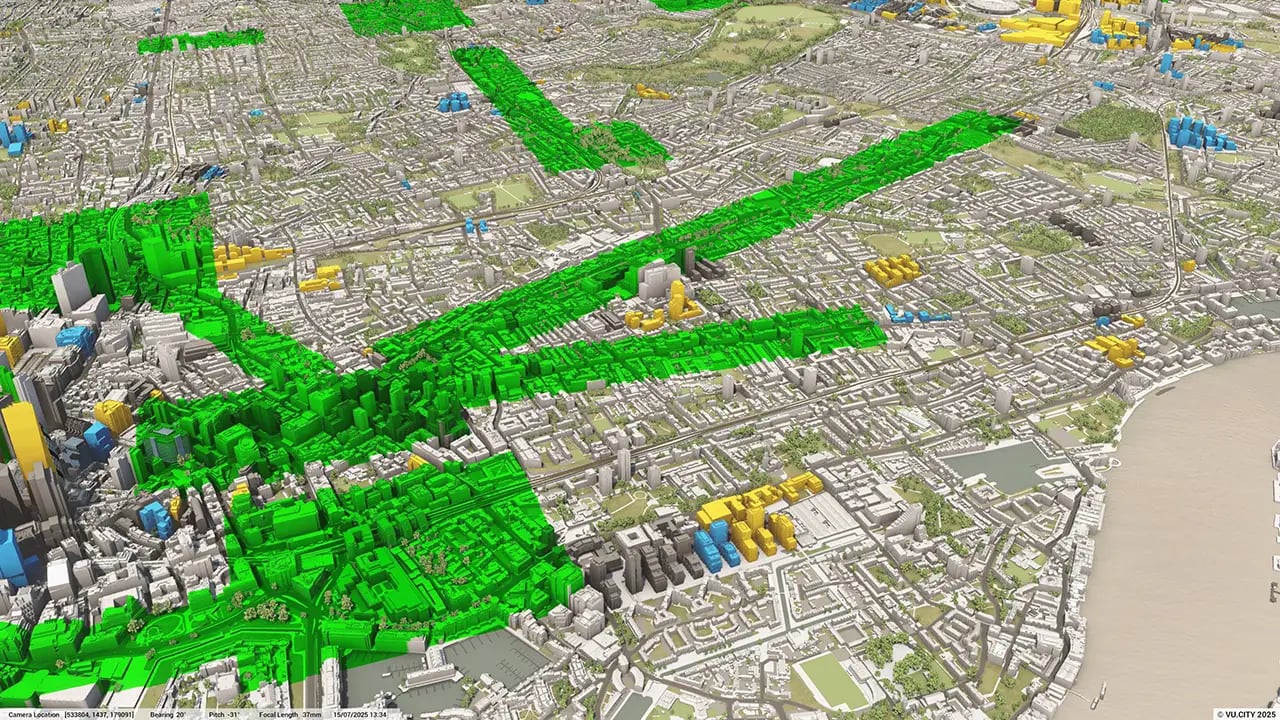
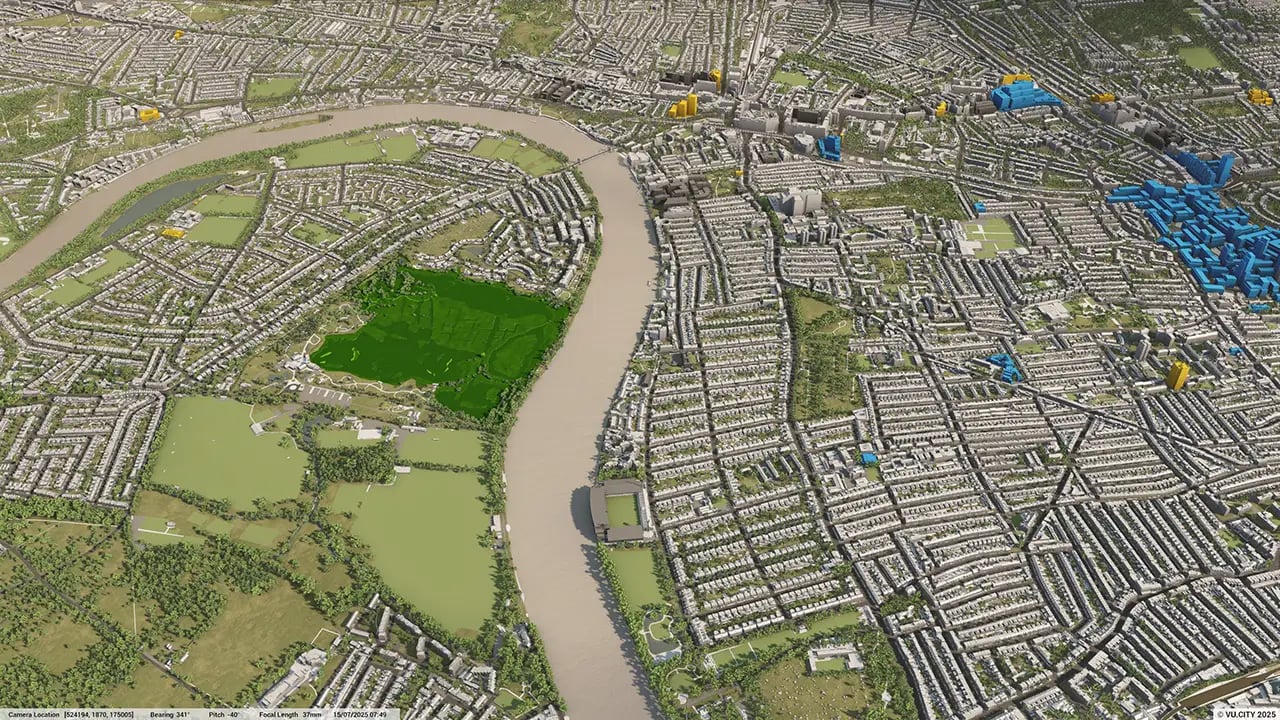
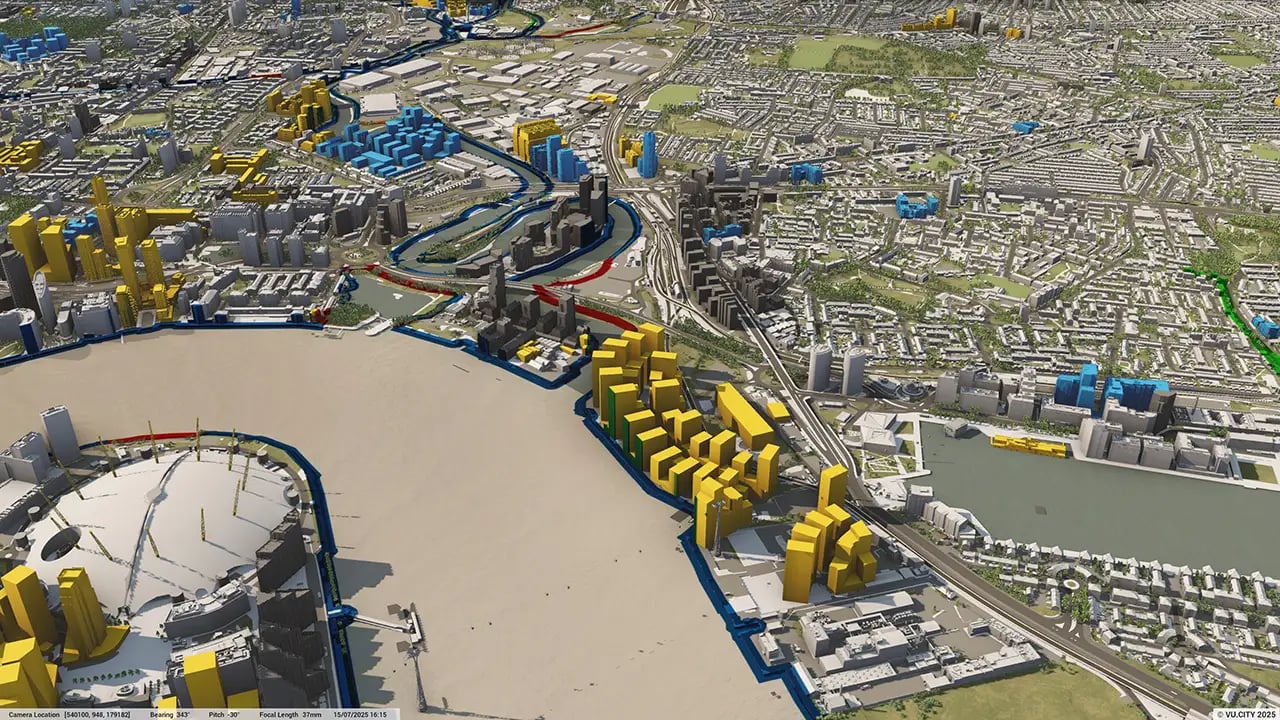
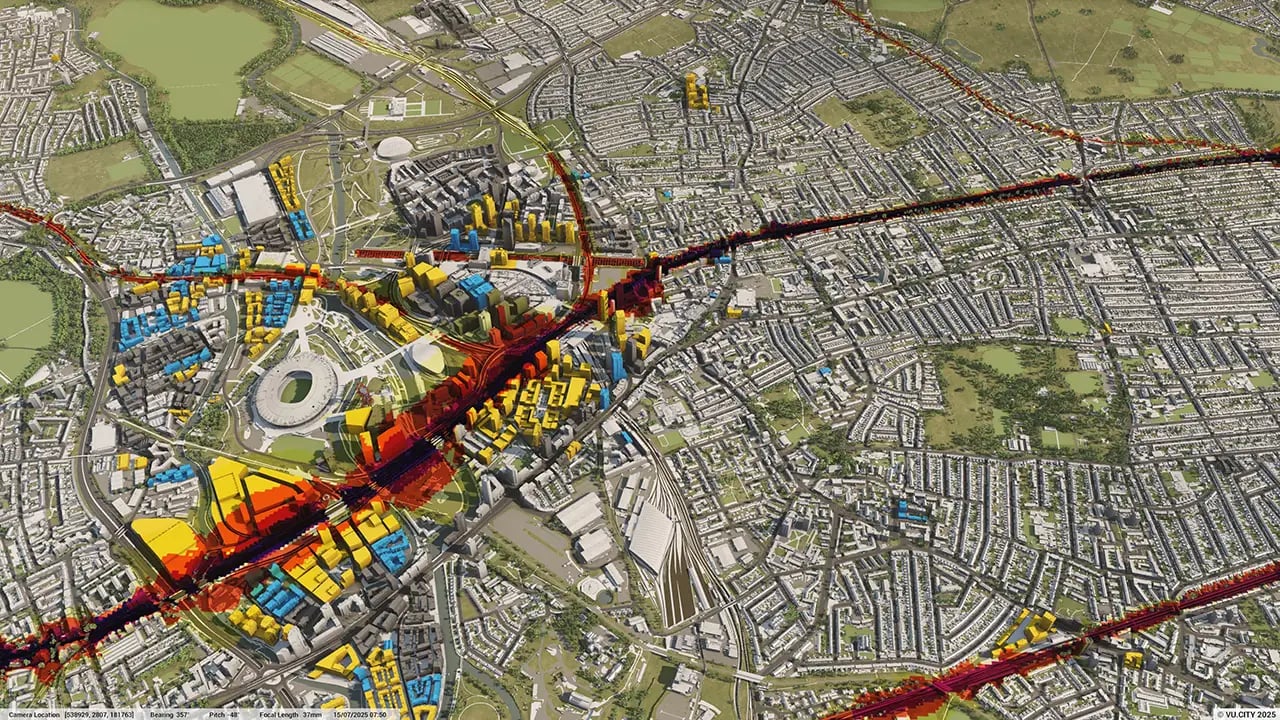
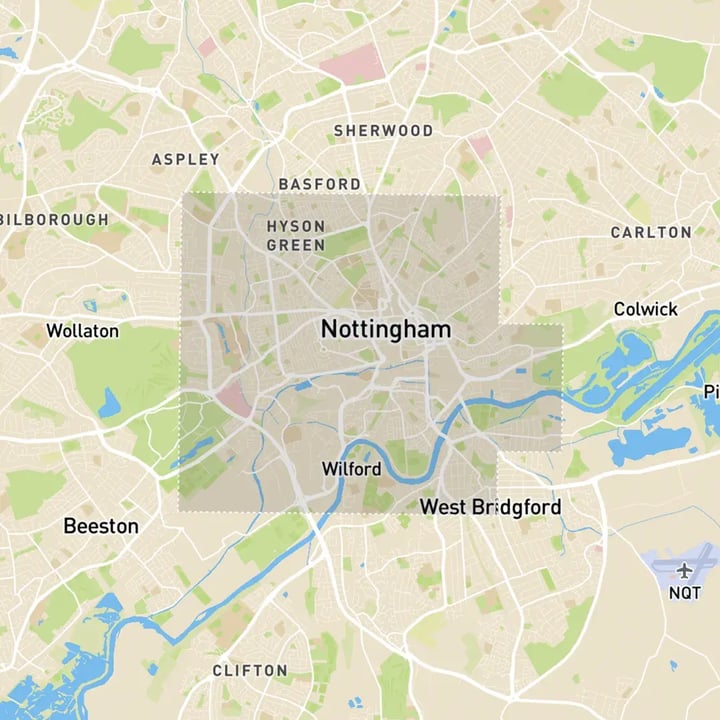
Nottingham 3D tile coverage
Whether you’re focusing on a single neighbourhood or the entire cityscape, VU.CITY provides full coverage with unmatched precision.
VU.CITY Nottingham FAQs
Here are some frequently asked questions about VU.CITY's Nottingham 3D Digital Twin and Model.
What is VU.CITY Nottingham, and how does it support city planning and development?
VU.CITY Nottingham is an advanced 3D digital model of Nottingham, aiding city planners, architects, and developers in visualising projects within the urban landscape, enabling better-informed decision-making.
How can VU.CITY Nottingham enhance the planning application process?
VU.CITY Nottingham provides an interactive model that helps stakeholders see proposed developments in context, streamline compliance with local guidelines, and enhance accuracy during the planning process.
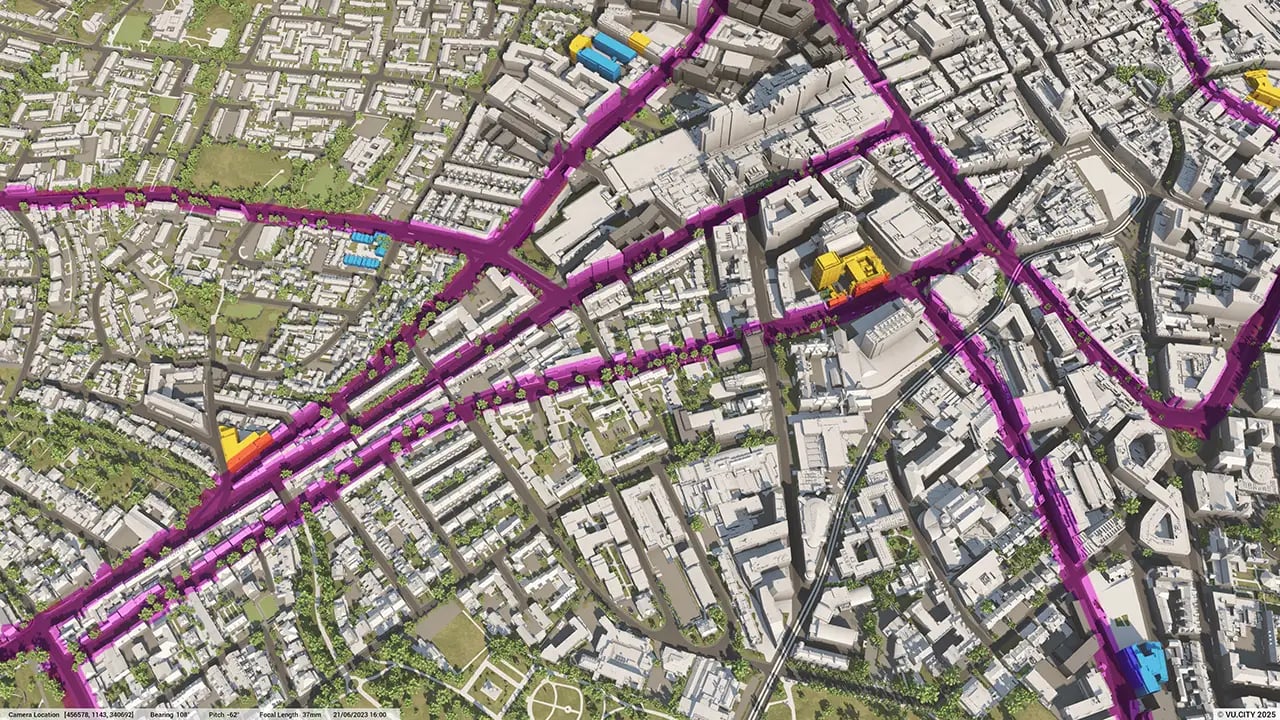
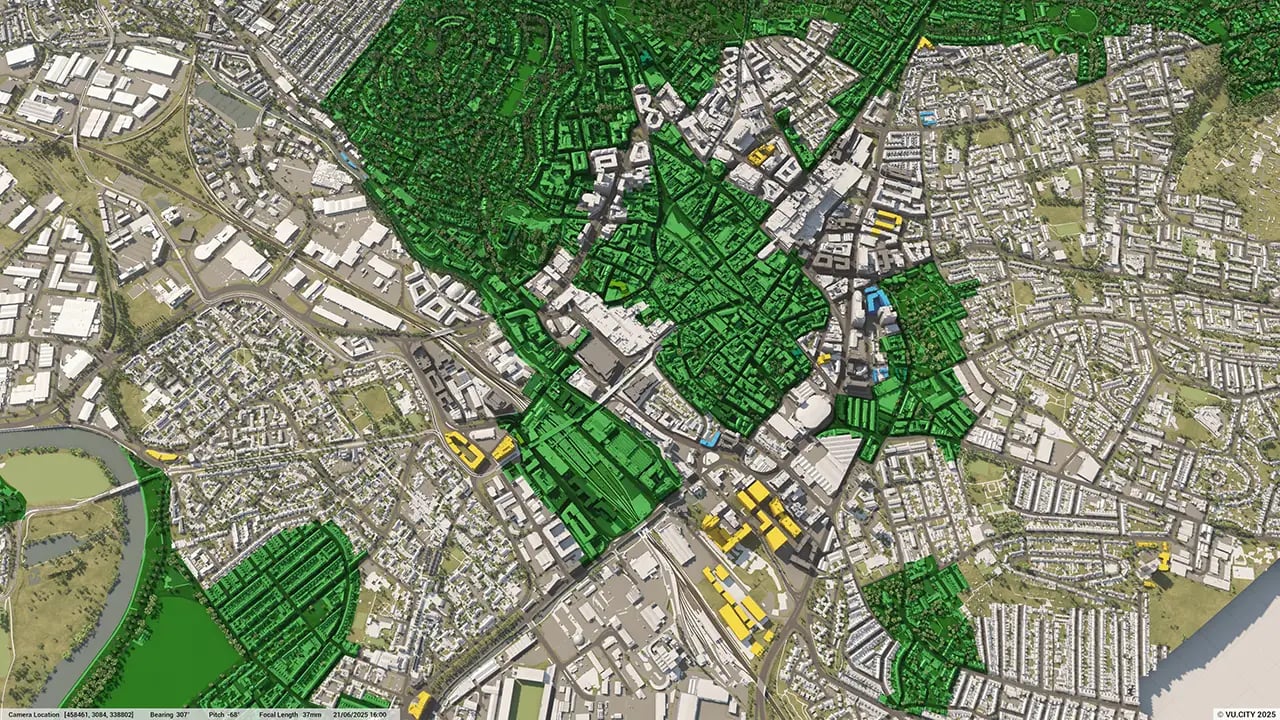
What types of data layers are available in VU.CITY Nottingham for project analysis?
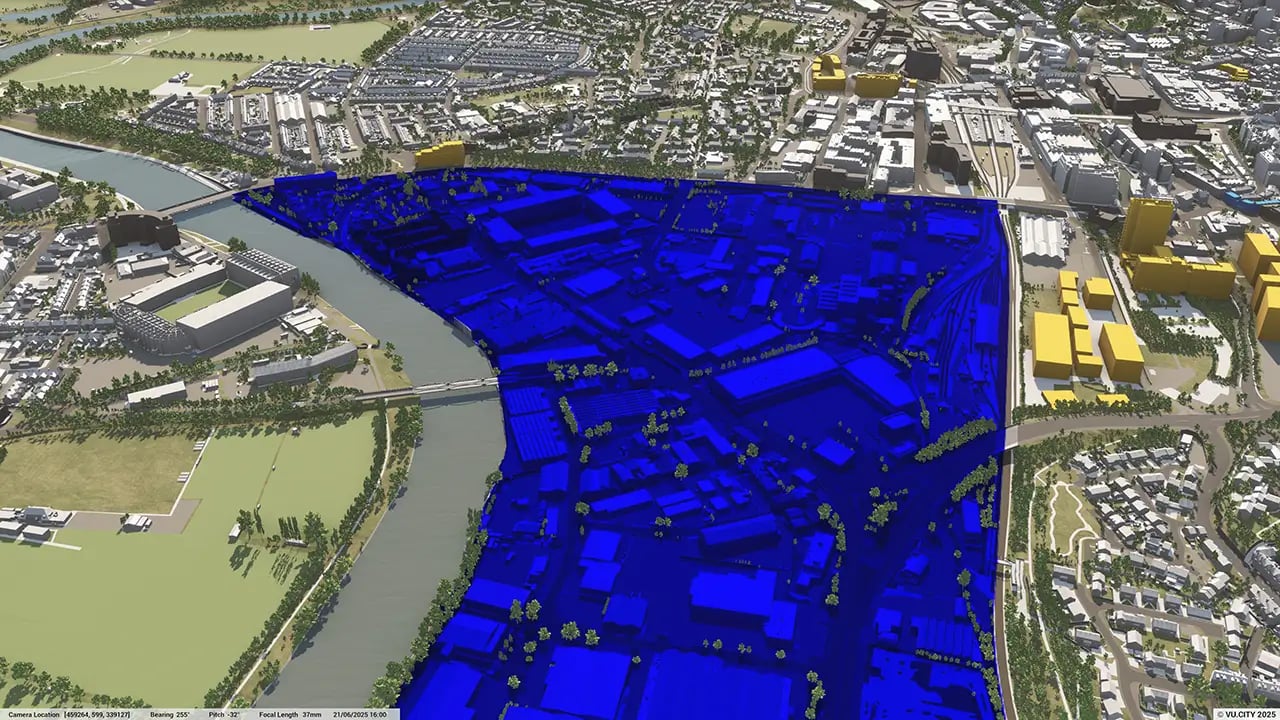
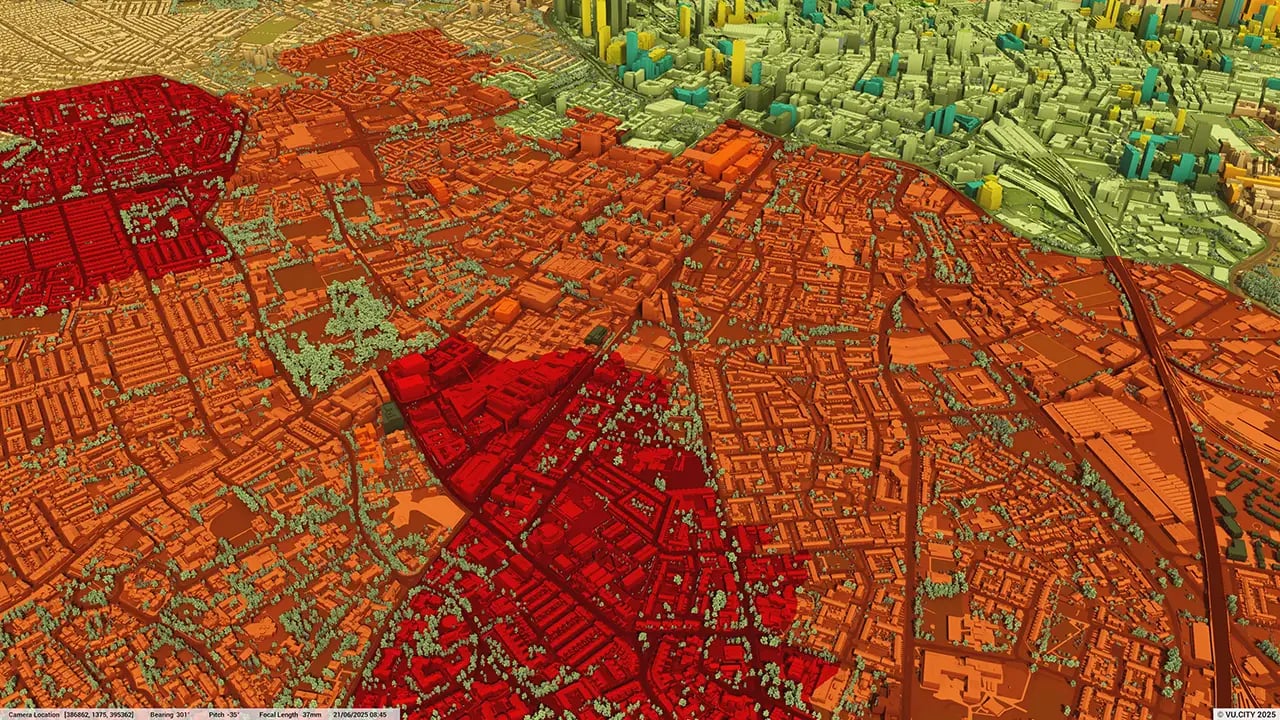
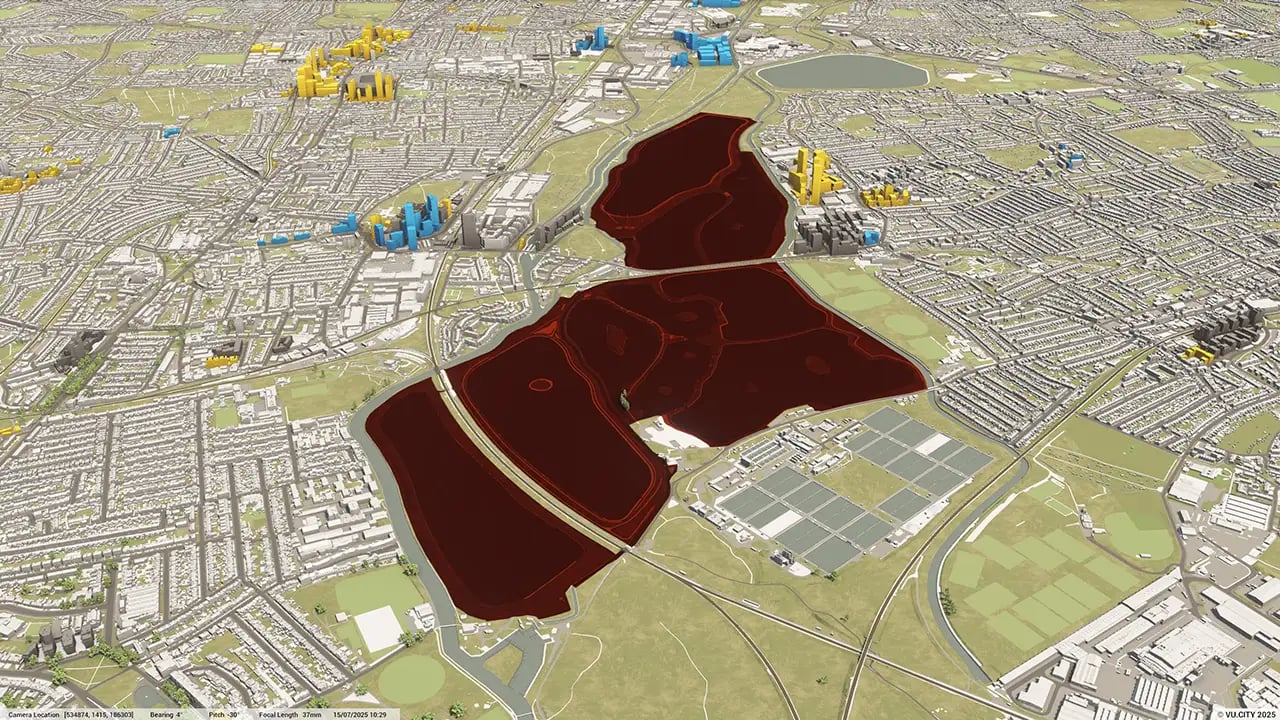
VU.CITY Nottingham includes data layers like transport networks, heritage sites, conservation areas, and flood risk zones, offering vital insights that support efficient, compliant planning.
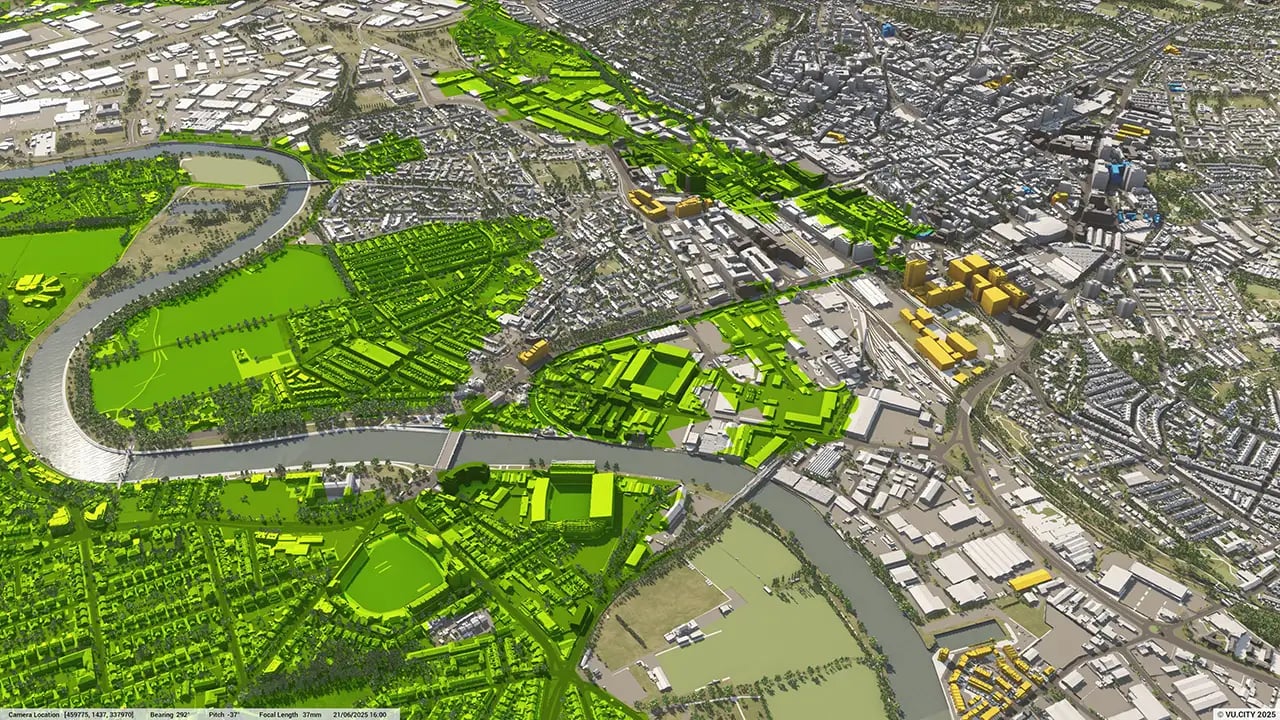
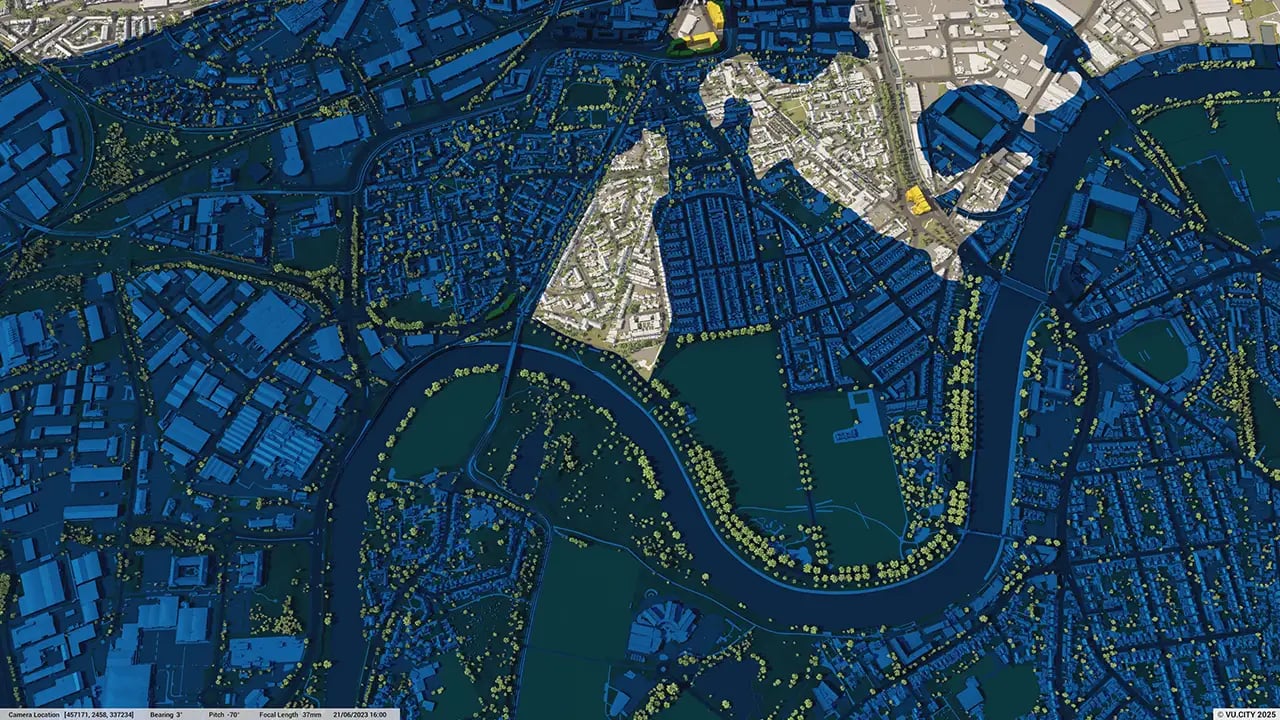
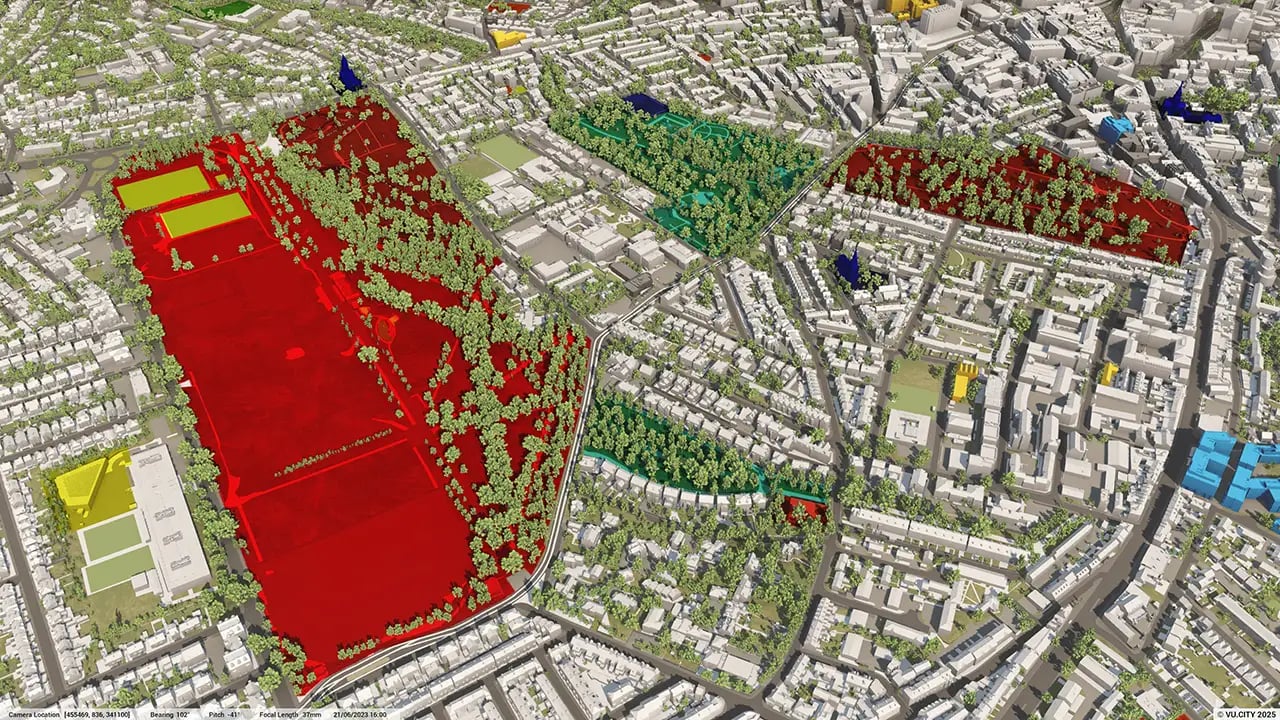
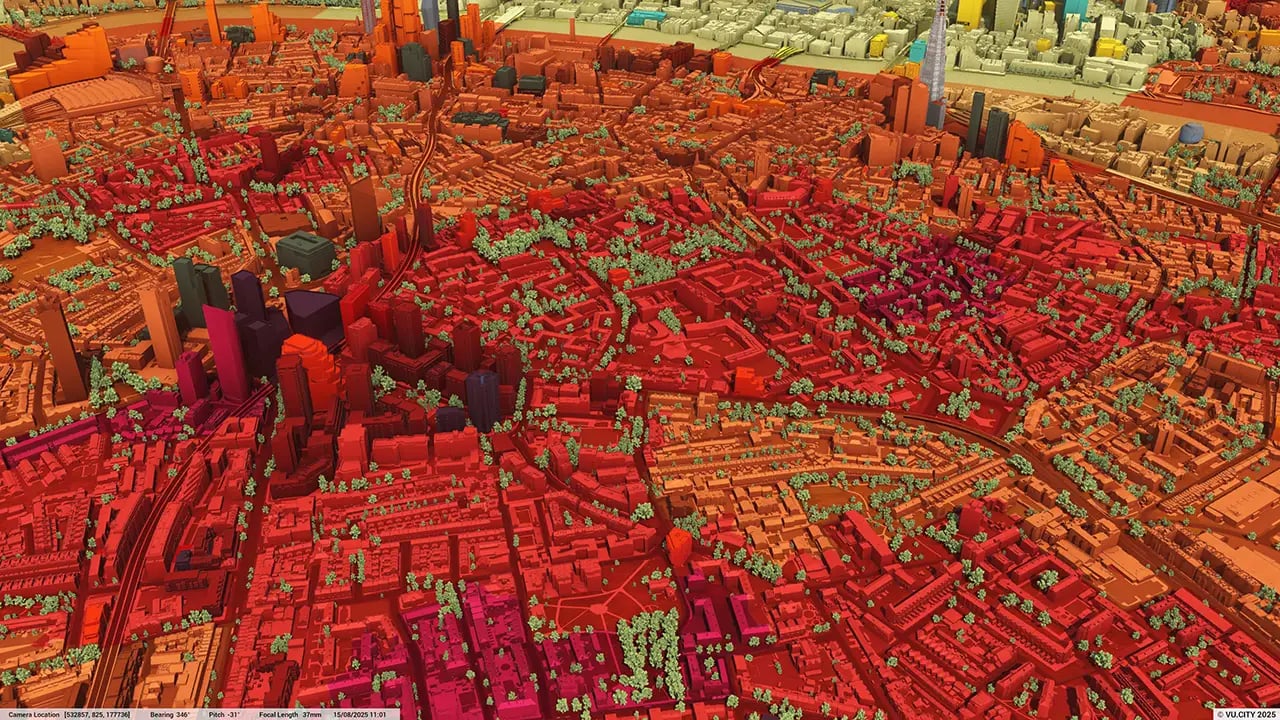
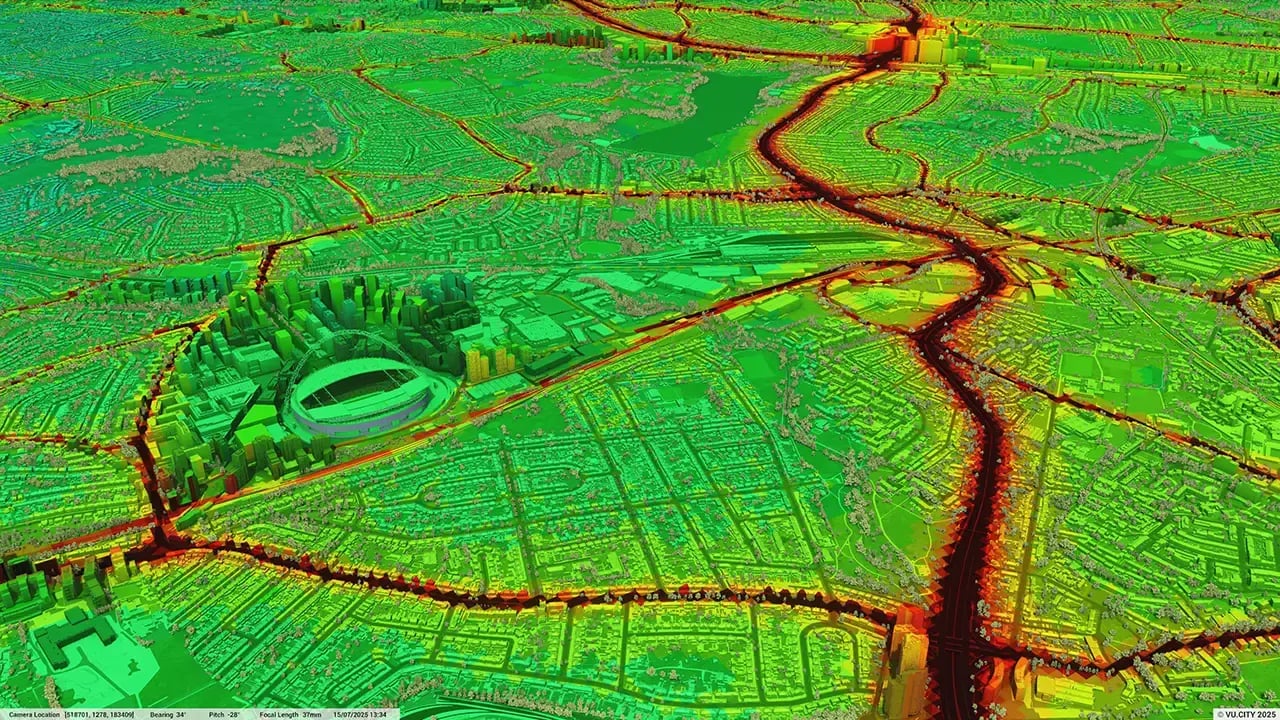
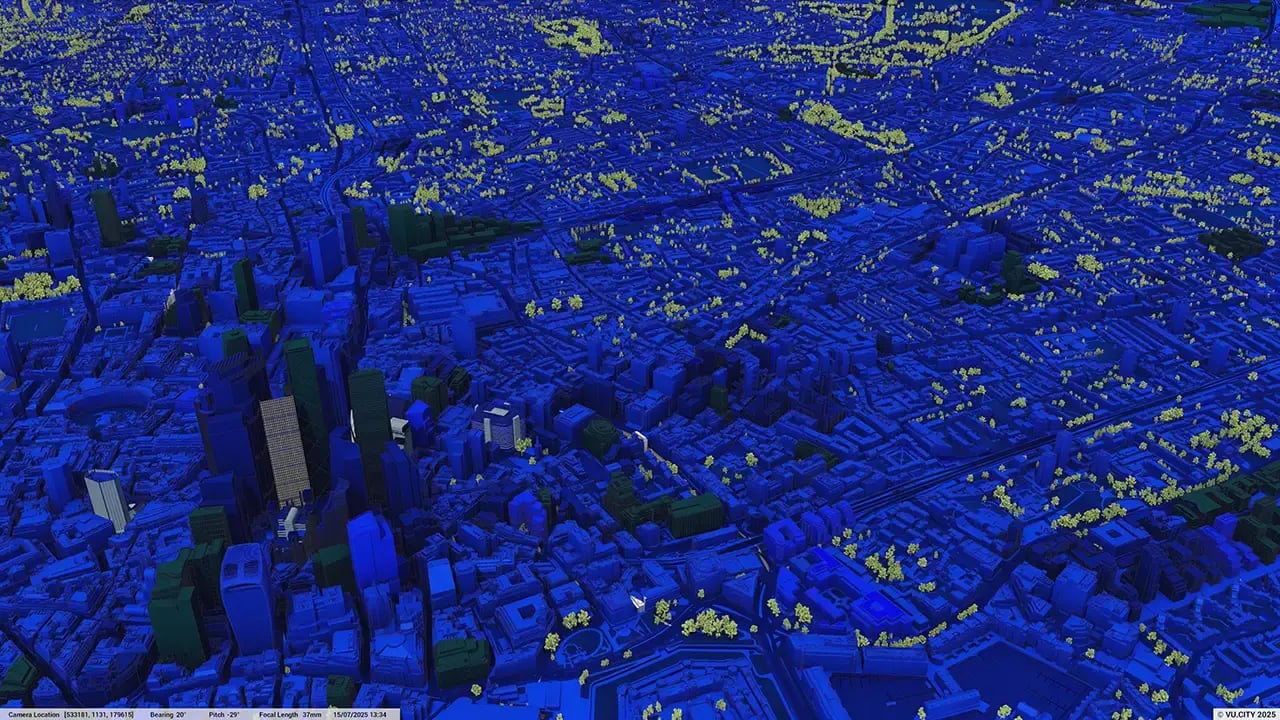
How does VU.CITY Nottingham support sustainable and eco-friendly urban planning?
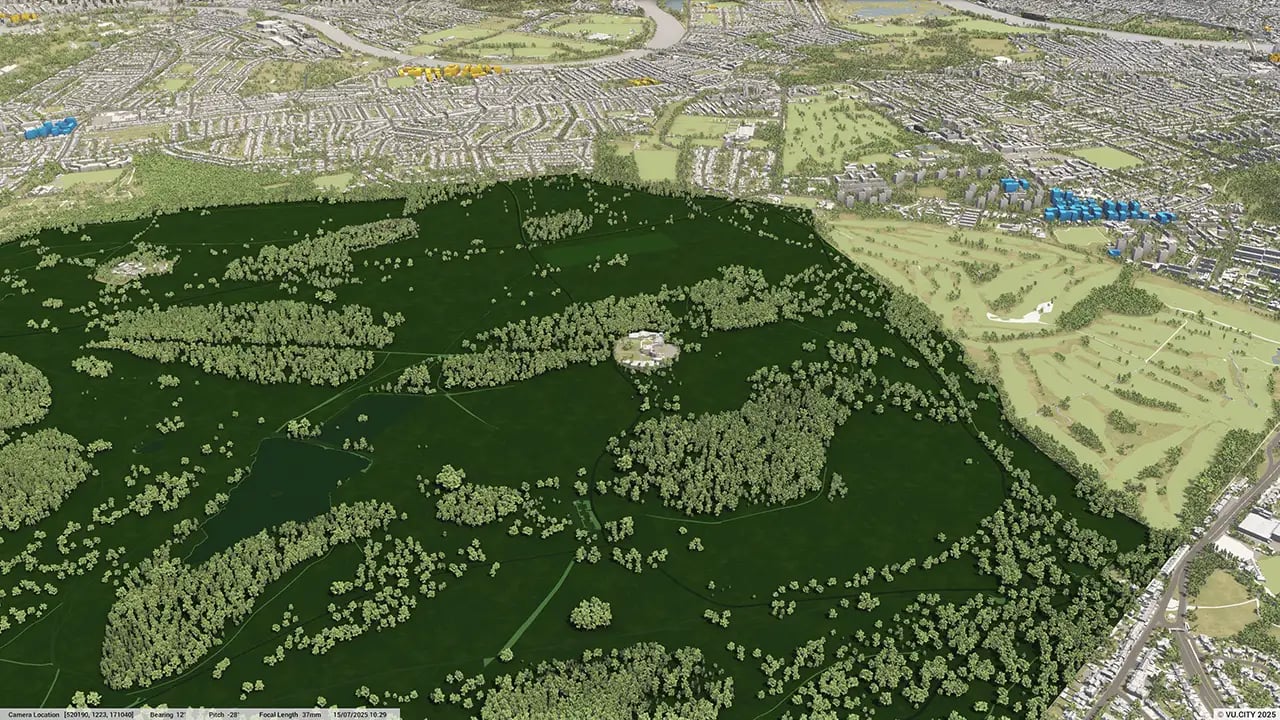
By visualising green spaces and assessing environmental impacts, VU.CITY Nottingham enables users to plan for sustainability, helping Nottingham reach its environmental and carbon-reduction goals.
How can VU.CITY Nottingham improve public engagement in city planning projects?
The 3D model allows for effective visualisation of developments, facilitating transparent public presentations and encouraging feedback, essential for inclusive urban planning in Nottingham.
Explore digital 3D geospatial solutions for the built environment
VU.CITY provides clear, powerful tools for key decision-makers across the built environment, helping them visualise and shape the future of cities with confidence and precision.
Make smarter decisions with data-driven insights, from infrastructure to sustainability.
Unlock the power of Generative AI for optimal design and streamlined decision-making.
Bring your designs to 3D life with state-of-the-art modelling tools.
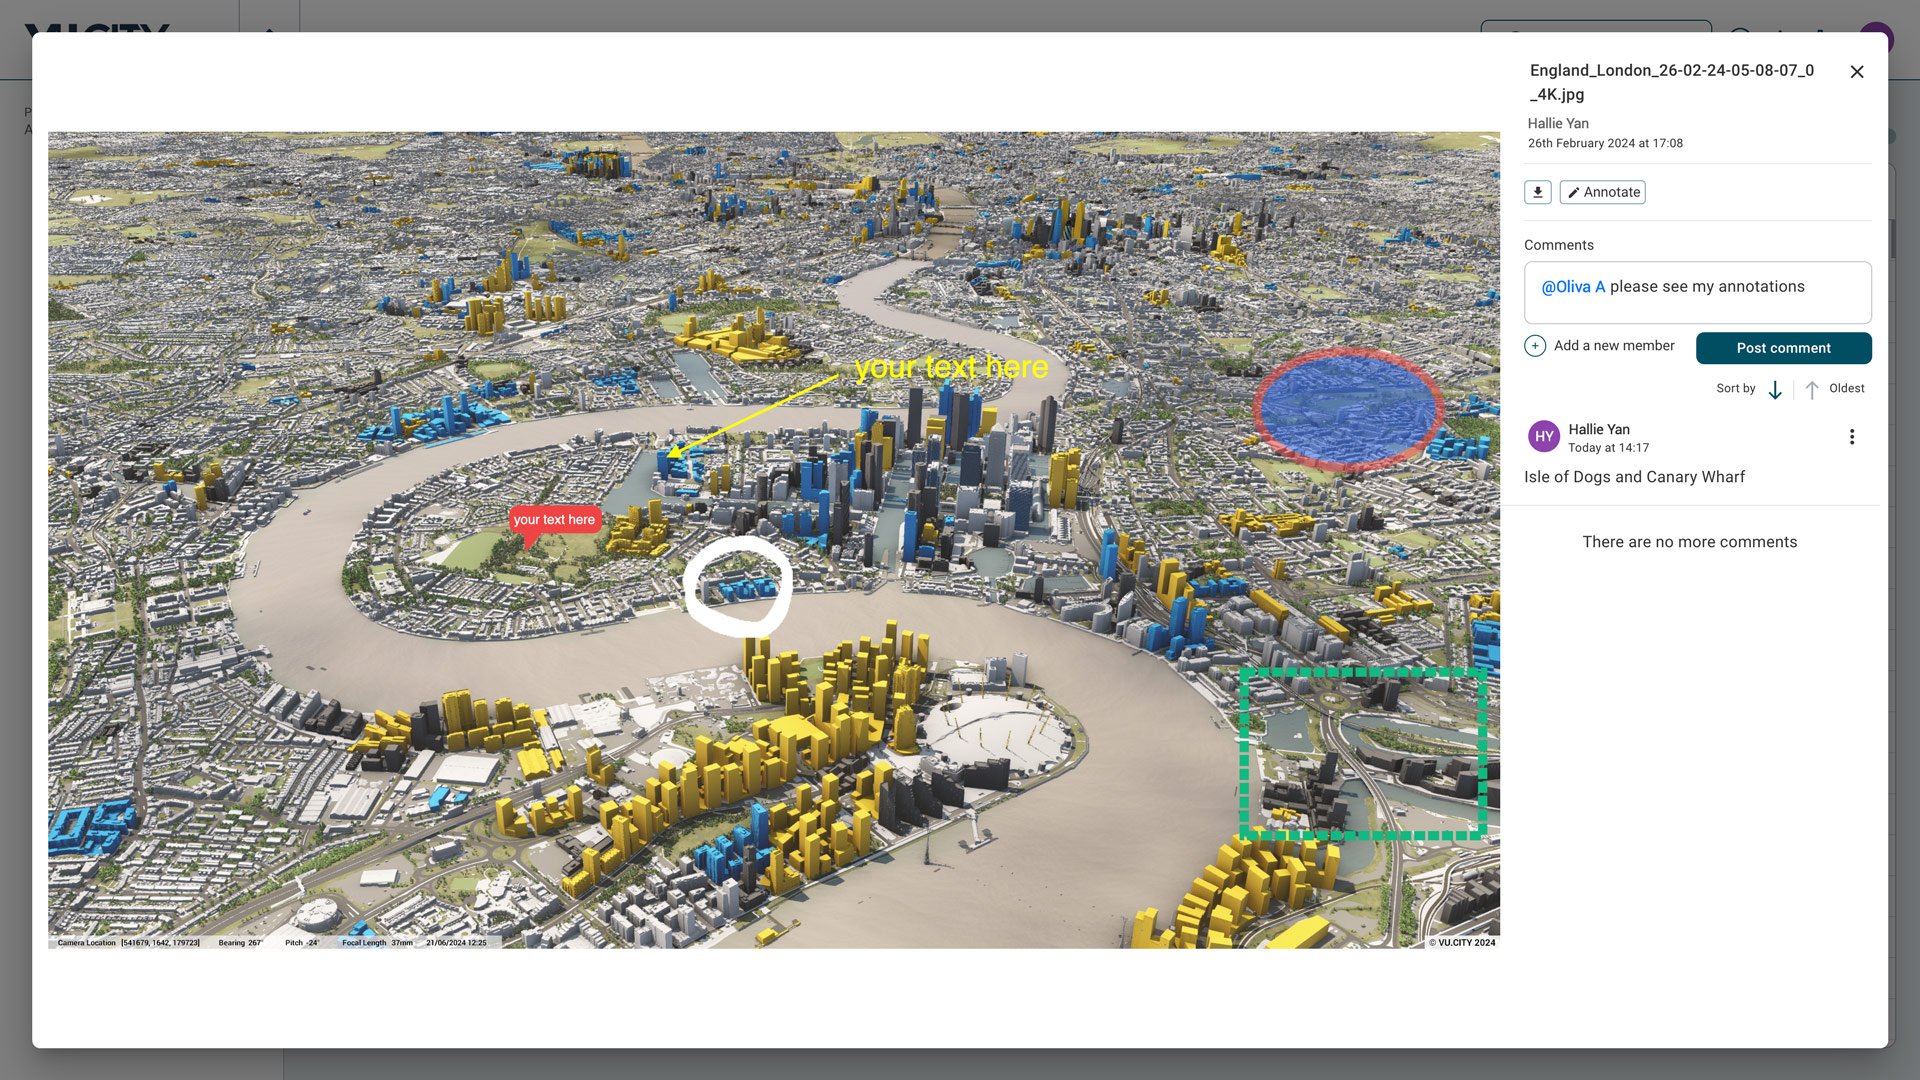
Collaborate seamlessly across studies, planning, and design.
Utilise advanced 3D models and a data-driven approach with our flexible ZTV service.
Bring Your Vision to Life with a 3D Flythrough Video.
26 UK & International Cities
Over 3,000+ sq km accurate to 15cm | Tools to scope, create & collaborate on designs
Shape Tomorrow’s Cities, Today.
Begin Your Free Trial Now.
- 1
- 2
- 3